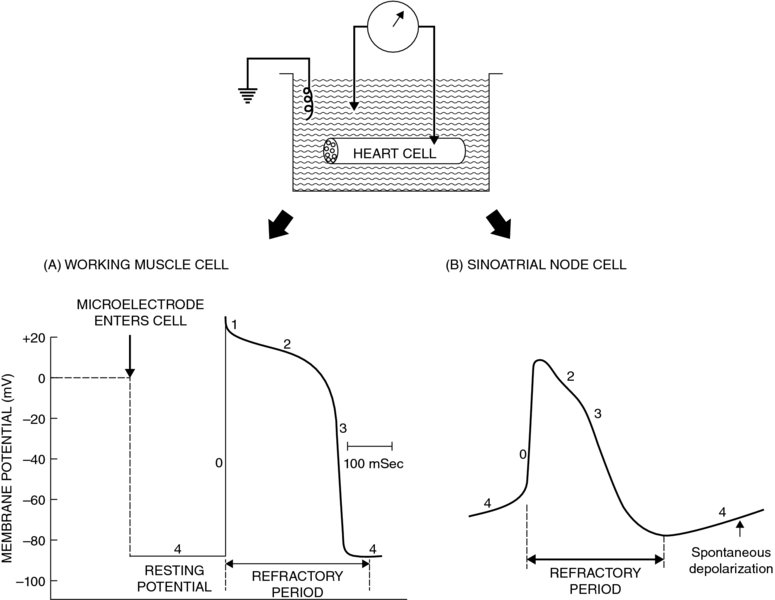
22 Kathryn M. Meurs and Jim E. Riviere The authors thank HR Adams for the original chapter upon which this is based. An arrhythmia is typically defined as an abnormality in the rate, regularity, or site of origin of the electrical impulse of the heart, or a disruption in impulse conduction such that the normal sequence of atrial and ventricular activation is changed. In many cases cardiac arrhythmias have no clinical importance, and in some cases are considered normal findings (sinus arrhythmia in the dog). However, arrhythmias that lead to very slow or rapid heart rates or very irregular heart rates can have significant clinical implications, particularly if cardiac disease is present. The decision to treat a cardiac arrhythmia with an antiarrhythmic should be based on many factors including heart rate, type of arrhythmia, presence or absence of clinical signs such as syncope or exercise intolerance, and presence of underlying heart disease. Arrhythmias in the face of underlying heart disease, particularly with myocardial dysfunction (dilated cardiomyopathy, etc.) can be likely to lead to the development of clinical signs, including sudden death. Although there are many antiarrhythmics, only a small number have been well studied and shown to be effective in veterinary medicine and this chapter will concentrate on those. This chapter focuses on the more common antiarrhythmic agents used in veterinary medicine and introduces their principal pharmacodynamic actions on cardiac rate and rhythm. Normal cardiac rhythmicity is maintained by (i) dominance of a single pacemaker discharging regularly with the highest frequency, (ii) rapid and uniform conduction through normal routes of impulse conduction, and (iii) long and uniform duration of the action potential and refractory period of cardiac myofibers. In addition, duration of the Purkinje fiber action potential normally outlasts that of the ventricular muscle, thus providing a safety factor preventing reentry and reexcitation of the Purkinje system by the muscle action potential. A disturbance in any of the preceding factors can be arrhythmogenic, for example an inappropriate increase in automaticity of normally latent pacemaker cells, abbreviation of the refractory period, slowing of conduction velocity, or disparate refractory periods of adjacent fibers. Likewise, treatment of arrhythmias with the drugs discussed in this chapter is aimed at correcting these disturbances by altering cardiac pacemaker threshold, sodium, potassium, and/or calcium currents. Arrhythmias often are associated with: imbalance of the parasympathetic and sympathetic branches of the autonomic nervous system; changes in serum electrolyte concentrations, especially potassium and calcium ions (K+ and Ca++); hypoxemia; acidosis; changes in concentration of carbon dioxide; excessive stretch of cardiac tissue; mechanical trauma; myocardial disease states such as congestive heart failure and viral myocarditis; numerous drugs; and ischemia and infarction of the heart muscle. Chapters 6, 7, and 8 on the autonomic system and the introduction to cardiac function in Chapter 21 should be consulted for an appropriate background in these areas. Hemodynamic instability occurring during cardiac arrhythmias results from alterations in heart rate, changing the regularity of heartbeats, and losing atrial assistance in ventricular filling. Electromechanical synchrony of the cardiac chambers is thereby lost, culminating in ineffectual filling and ejection of the ventricles and hemodynamic deterioration of the patient. Antiarrhythmic drugs suppress arrhythmias and help restore hemodynamic stability by altering basic electrophysiological processes in the heart. The classification system for clinically useful antiarrhythmic drugs is based mainly on the predominant pharmacological effects of a drug on the action potential of cardiac cells (Vaughn Williams, 1984; Adams, 1986). Accordingly, a useful understanding of antiarrhythmic drug actions and affiliated nomenclature depends first on a good comprehension of basic bioelectric properties of the heart. An overview of salient features of this topic is outlined here relative to action potentials of cardiac cells and types of cardiac arrhythmogenesis. The electrical activity of individual heart muscle cells can be recorded with a microelectrode capable of entering the intracellular space of a single cell, as shown schematically in Figure 22.1. Some of the common terms used to describe the configuration and ionic determinants of cardiac action potential components are defined here (Adams, 1986): Membrane potential is the voltage difference across the cell membrane, that is the difference in electrical voltage between the intracellular and extracellular spaces. By convention, the resting membrane potential is defined as the charge inside the cell relative to the extracellular side, in which case the resting potential is a negative charge. An increase in resting membrane potential would therefore designate a more negative intracellular charge (e.g., an increase from −70 to −90 mV), while a decrease in resting membrane potential would designate a less negative intracellular charge (e.g., a decrease from −70 to −50 mV). Figure 22.1 Cardiac action potentials recorded from a working myocardial cell (A) and a sinoatrial pacemaker cell (B). The nonautomatic working muscle cell (A) exhibits a constant phase 4 resting potential during diastole, whereas the automatic cell (B) undergoes spontaneous depolarization during phase 4, leading to threshold and spontaneous excitation. The cell is inexcitable or poorly responsive to additional stimuli during much of the action potential, and this refractory period helps prevent premature excitation. See text for further details. Source: Adams, 1986. When a cardiac cell is stimulated, the electrical potential measured across the cell membrane undergoes a depolarization and repolarization cycle that can be differentiated into five sequential components. These components are referred to as phases 0, 1, 2, 3, and 4 (Figure 22.1). The precise morphology of the 5 phases of the cardiac action potential varies with the anatomic region of the heart. A schematic diagram illustrating the configuration of action potentials derived from sinoatrial (SA) tissue, atrial muscle (AM), Purkinje fibers (PF), and ventricular muscle (VM) is depicted in Figure 22.2 along with corresponding waveforms of the electrocardiogram (ECG). Action potentials of a sinoatrial pacemaker cell (Figure 22.1B) and a typical working heart muscle cell (Figure 22.1A) will be addressed as examples of cardiac tissue with and without normal automaticity, respectively. Figure 22.2 Schematic diagrams demonstrating the temporal relationships between transmembrane action potentials recorded from cells of the sinoatrial node (SA), atrial muscle, Purkinje fibers, and ventricular muscle (see text for discussion). Modeled after Trautwein, 1963. Source: Adams, 1986. Electrical diastole is designated by phase 4 of the cardiac action potential (Figure 22.1A); this resting membrane potential is steady at about −90 mV. Polarization across the cell membrane is maintained primarily because of the unequal distribution of K+ inside and outside the cell. The Na+,K+-adenosine triphosphatase transport system maintains high intracellular K+ relative to extracellular K+, and the cell membrane is selectively permeable to K+ during phase 4 diastole when compared to other ions such as Na+ or Ca++. When the cell is stimulated to its particular threshold level, however, the selective permeability characteristics of the cell membrane to K+ are momentarily lost. Other ions now cross the sarcolemma and produce the typical depolarization–repolarization cycle that comprises the action potential (Figure 22.1). Phase 0 of the action potential reflects the extremely rapid depolarization spike produced by Na+ rushing into the cell through specific “fast Na+ channels” or passageways of the sarcolemma. Phase 0 is terminated as early (phase 1) and delayed (phase 3) repolarization occur, restoring the membrane potential to its resting diastolic level of phase 4 (Figure 22.1). The cell is refractory to additional stimuli during the early and intermediate phase of the action potential cycle; it is only partially responsive if stimulated prior to complete repolarization and return to normal phase 4 diastolic potential. The phase 2 plateau of the action potential partially represents a brief anomalous delay in restoration of K+ permeability (Figure 22.1). A critically important component of phase 2 comprises an influx of Ca++ through specific “slow Ca++ channels” or “slow cation channels” of the cell membrane. This slow inward Ca++ current is the mechanism whereby membrane excitation is coupled to activation of the contractile elements of heart muscle cells (Parker and Adams, 1977). The influx of Ca++ during phase 2 triggers a release of greater amounts of Ca++ from intracellular storage sites, and the increased cytosolic Ca++ proportionately activates the contractile machinery of the myocardial cells. Unlike working myocardial cells, automatic cells do not exhibit a clearly definable resting membrane potential during phase 4. Instead, phase 4 is characterized by a slow spontaneous depolarization to threshold potential (Figure 22.1B), thereby discharging automatically and leading into the more rapid depolarization of phase 0. However, the slope of phase 0 depolarization of SA pacemaker cells is much less than that of working muscle cells (Figures 22.1, 22.2). This distinction may be explained by a component of slow Ca++ influx in the genesis of phase 0 depolarization in these types of automatic cells (Adams, 1986). Cells with normal automaticity (i.e., spontaneous phase 4 depolarization) also are found in specialized atrial conduction tracts, the distal region of the AV node, AV valves, and PF. The basic mechanisms involved in genesis of cardiac arrhythmias involve abnormalities of impulse formation (i.e., arrhythmias caused by changes in automaticity), impulse conduction (i.e., arrhythmias caused by reentry phenomena), and a combination of automaticity and reentry (Singh et al., 1980; Binah and Rosen, 1984). The action potential from the SA node, AM, PF, and VM are shown in Figure 22.2. The five phases of the action potential (0, 1, 2, 3, 4) are numbered in the first complex of VM. Notice spontaneous depolarization (SD), maximal diastolic potential (MDP), and threshold potential (TP) in the automatic cells of SA and PF. The resting membrane potential (RMP) is shown in the nonautomatic cells of the AM and VM. The P wave of the ECG corresponds to depolarization of SA and AM, while the QRS complex and T wave correspond to depolarization and repolarization, respectively, of ventricular cells (Figure 22.2). Automatic cells of the SA node normally are the dominant pacemaker, reaching threshold first with the resultant propagating impulse exciting all other potential pacemaker cells before they spontaneously attain threshold values (Figure 22.2). If automaticity of the SA node is depressed or the spontaneous firing rate in some other tissue (latent pacemaker) is accelerated, regions of the heart other than the SA node may serve as the pacemaker and initiate ectopic impulses. Examples are shown in Figure 22.3. Figure 22.3 Schematic representations of transmembrane action potentials of cardiac cells with the property of automaticity and potential mechanisms whereby antiarrhythmic drugs can influence automaticity (see text for discussion). Source: Adapted from Hoffman and Cranefield, 1960; Mason et al., 1973. Automaticity is enhanced when the slope of phase 4 SD is increased (e.g., from a to b in I of Figure 22.3); this decreases the time required to reach TP, thereby increasing the frequency of spontaneous discharge. The result is an increase in heart rate when the SA pacemaker is involved or emergence of ectopic beats if a normally latent pacemaker is involved. By decreasing the slope of spontaneous depolarization (e.g., from b to a or from a to c in I of Figure 22.3), drugs can depress ectopic foci and restore normal sinus rhythm without affecting MDP or TP. If a drug raises TP to less negative values (e.g., from TP-a to TP-b in II of Figure 22.3), additional time will be required to reach TP, thereby depressing automaticity. By increasing the MDP (e.g., from MDP-a to MDP-b in III of Figure 22.3), a drug can suppress automaticity because additional time would be required before TP is attained. Arrhythmias caused by disturbances in impulse conduction are thought to be associated with a phenomenon of reentry or circus movement. The concept of reentry is based on very slow conduction velocity, an area of the heart demonstrating unidirectional block of impulse conduction and perhaps an abnormally brief refractory period (Schmidt and Erlanger, 1929; Wit et al.,). This theory holds that a cardiac impulse can travel circuitously around an anatomic loop of fibers in which slowed conduction velocity and brief refractoriness permit the impulse to arrive at cells that are no longer refractory, thereby permitting perpetual reexcitation. A schematic demonstration of impulse reentry at a junctional region between PF and ventricular muscle is shown in Figure 22.4 (Adams, 1986). Conduction can be significantly slowed by pathological lesions in the heart tissue. Because of slowed conduction, a reentry stimulus can excite tissue that would have otherwise been refractory. Reentry theoretically could be controlled by a drug that either creates bidirectional block or bidirectional conduction through the region of cells causing the unidirectional block; accelerates speed of impulse conduction, thus returning the impulse to the site of reentry when cells are still refractory; prolongs action potential duration of normal cells, thereby extending their refractory period; or exhibits a combination of the above actions. Figure 22.4 Schematic representations of potential mechanisms involved in cardiac arrhythmias caused by reentry phenomena. I. Normal. The cardiac impulse (arrows) exits a main bundle branch (MB) of the Purkinje system and enters terminal Purkinje branches A and B. The impulse uniformly and rapidly excites a segment of ventricular muscle (VM) and would be extinguished within the VM due to refractoriness of the cells just excited. II. Normal conduction and unidirectional block. Because of an area of damaged tissue (shaded area) that blocks antegrade conduction in branch A, the impulse traversing branch B and the VM will excite branch A. The impulse will traverse branch A and the area of unidirectional block through a retrograde pathway; however, since it is conducted at a normally fast speed, it will encounter refractory cells (open square) and be extinguished. III. Slow conduction velocity and no block. Although the cardiac impulse may be conducted at an abnormally slow velocity (wavy arrows), the lack of unidirectional conduction block causes the impulse to arrive at refractory cells and extinguish. IV. Slow conduction and unidirectional block. Same as II but the speed of impulse conduction through the area of unidirectional block (wavy arrows), and perhaps through B and VM as well, is so slow that the impulse encounters cells after their refractory period. Thus the impulse can reenter the conduction pathway, thereby establishing perpetual reexcitation. Modeled after Cranefield, 1973; Mason et al., 1973. Source: Adams, 1986. Other forms of cardiac electrophysiological disturbances, in addition to primary abnormalities of impulse conduction and automaticity, may be important. Examples include abnormal excitability, early/late afterdepolarizations, and triggered electrical activities. These types of abnormalities overlap mechanistically with disturbances of automaticity and impulse conduction. Arrhythmias arising from primary automaticity and conduction abnormalities are adequate for modeling the classes of antiarrhythmic drugs relative to their effects on cardiac action potential characteristics and arrhythmogenesis. Based on mechanisms described above, particularly with respect to ion conduction across cardiac cell membranes, antiarrhythimic drugs can be classified using the traditional Vaughn Williams classification scheme discussed in Section Electrophysiological Properties of Cardiac Cells. This classification is presented in Table 22.1. Table 22.1 Classification of antiarrhythmic drugs based on mechanism of action: Vaughn Williams classification system. Source: Data from Vaughn Williams, 1984. Local anesthetics Procainamide Quinidine Local anesthetics Lidocaine Mexiletine β1-adrenergic blockers Propranolol Atenolol Metoprolol Potassium channel blockers Amiodarone Sotalola Calcium-channel blockers Verapamil Diltiazem aSotalol also has beta-blocking (Class II) properties. Antiarrhythmic drugs are divided into Classes I to IV in this system. Although the clinical importance of this classification scheme has been debated (see Vaughn Williams, 1992), some familiarity with the system is still of value. Some drugs (e.g., digoxin, anticholinergic agents, vagolytics, sympathomimetics) are not classified by this system. Class IB antiarrhythmics have a greater impact on conduction velocity and effective refractory period in abnormal cardiac tissue than in normal tissue. Additionally, their effect is most profound in Purkinje fibers and they have very little effect on the sinus node, atrioventricular node, or cardiac contractility. Examples used in veterinary medicine are lidocaine and mexiletine.
Antiarrhythmic Agents
Rhythmicity of the Heart
Electrophysiological Properties of Cardiac Cells
Action Potentials of Cardiac Cells

Working heart muscle cells:
Sinoatrial pacemaker cells:
Classification of Arrhythmogenic Mechanisms
Disturbances in Automaticity

Disturbances in Impulse Conduction

Antiarrhythmic Drugs
Class
Drug
Effect on Na+ channels
Effect on K+ channels
Effect on Ca++ channels
Effect on action potential
Class Ia
Depresses
Depresses
–
Lengthens action potential Increases refractory period
Class Ib
Depresses
Depresses
–
Does not increase refractoryperiod as Class Ia drugs
Class II
Depresses
–
Depresses
Suppresses SA, AV node Decreases rate
Class III
–
Depresses
–
Prolongs refractory period Lengthens action potential
Class IV
–
–
Depresses
Suppresses SA, AV node Decreases rate
Stay updated, free articles. Join our Telegram channel

Full access? Get Clinical Tree


