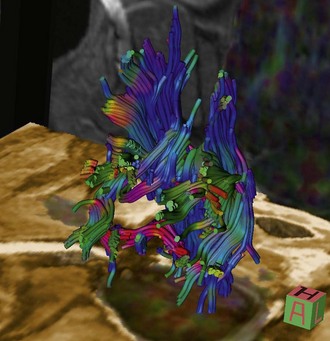
Advanced Imaging for Surgeons

Chapter 15


Advanced Imaging for Surgeons


Sophisticated imaging techniques such as computed tomography (CT), magnetic resonance imaging (MRI or MR), and, more recently, positron emission tomography with CT (PET/CT) can be integral parts of the workup of pets with challenging surgical diseases. This chapter provides an overview of the underlying physics and imaging principles of these advanced imaging modalities and provides clinical examples of how they can be used to aid in the diagnosis and perioperative management of patients. Since its inception, CT has been used to help resolve complex anatomy. MRI has become the imaging modality of choice for neurosurgery. PET/CT provides important information on both the anatomic location and physiologic function of a variety of diseases. These modalities give the clinician important information on the anatomic or physiologic extent of the disease process.


Medical imaging is no longer just about the noninvasive viewing of anatomy. Modern imaging techniques can provide a wealth of information beyond anatomic interpretation. At one end of the spectrum lies pure anatomic imaging; at the other end is pure physiologic imaging. Techniques such as standard planar radiography provide excellent information regarding anatomic structure (especially that of bone), but they do not provide information regarding function of the imaged anatomy. Traditional nuclear medicine (bone scans, thyroid scintigraphy) has provided reliable physiologic imaging and has been commonly utilized in veterinary medicine. Newer modalities such as PET can image glucose metabolism, rates of cell proliferation, and the biodistribution of a drug but do not provide anatomic detail. Hybrid imaging, which provides detail regarding function and anatomy, has increasingly become important in medical imaging. Combining modalities that provide complementary information, such as PET/CT, provides data that are often more useful than the individual information. CT is able to precisely determine anatomy, whereas PET is able to provide information on regional physiology; fusing the two modalities can offer tremendous insight. Other examples of hybrid imaging in use today include excretory urography and upper gastrointestinal (GI) studies, which provide anatomic and limited physiologic information. With ultrasonography, one can look at both anatomy with B-mode and velocity with Doppler imaging, giving information regarding structure and function.


Physics: Overview


Magnetic Resonance Imaging (MRI)


Important concepts when considering the physics of MR imaging is that all living things have magnetic and electrical properties and that magnetism and electricity are interchangeable. Magnetic resonance imaging is based on the magnetic properties of living tissue, primarily protons of hydrogen atoms. The majority of atoms in the body are hydrogen, principally as a component of water (H2O), which makes it a particularly useful atom for MR imaging. The proton has a spin and a charge; because this is a moving electrical charge, it constitutes an electrical current. This electrical current induces a magnetic field; therefore, each spinning proton produces a tiny magnetic field. Each proton behaves as a tiny dipole magnet or compass needle. In addition to spinning on its axis, a proton in a magnetic field will rotate like the wobbling of a spinning top. This wobbling or rotating motion is called precession; the frequency of this precession depends on the strength of the static magnetic field (B0) and inherent characteristics of hydrogen protons. The frequency with which a proton will precess at a given magnetic field strength (measured in Tesla) is called the Larmor frequency. Normally, the individual magnetic fields of the body’s protons are randomly oriented. During MR imaging, a patient is placed in a static magnetic field and a slight majority of the body’s protons will align themselves longitudinally with that field, precessing along the field’s axis; this produces a net magnetic vector in the direction (the +z direction) of this static magnetic field. Although this magnetic field is technically uniform, there are intrinsic and extrinsic inhomogeneities within the field that lead to individual protons precessing at slightly different “schedules” rather than being “in phase” with each other. This can be likened to a group of clocks on a wall in a hotel lobby; typically, each clock has a different time, corresponding to the local time in a different major city (e.g., New York, Paris, and London). All clocks have the same frequency but are out of phase. If all the clocks were set to the local time in the city in which the hotel was located, they would be in phase. This concept of phase coherence is important to the understanding of signal generation, especially when considering T2 relaxation (discussed later).


The basic sequence of events in MR imaging involves excitation of protons by administering radiofrequency (RF) pulses, discontinuing the RF pulses, and collecting the RF energy that is released when the protons “relax” to their original energy states; this released energy is converted into an image. These displaced protons will, as a group, produce a net magnetic vector at an angle (the vector is in the x-y plane-longitudinally displaced from the original magnetic field or B0) to the static magnetic field with which they were previously aligned. The angle of this displacement depends on the strength of the RF pulse applied to the patient. It is important to realize that displacement of the net magnetic vector away from the z-axis is necessary for a detectable RF signal to be produced. Vectors aligned with B0 will not produce detectable signal (whether in the +z or –z direction) because the vector will be too weak compared to B0 to be detected by the receiver coils. As before, following displacement by an RF pulse, the protons will again precess around the new magnetic vector. However, in addition to displacing the net magnetic vector of the precessing protons to a higher energy level, the application of an RF pulse also tends to rephase the individual protons, bringing them back into phase coherence. After a 90° RF pulse, however, protons tend to quickly lose phase coherence again or dephase, a process referred to as free induction decay.


When the RF pulse is discontinued, the protons tend to “relax” back into alignment with the original magnetic field. In addition, the protons will lose phase coherence. As they relax, they release the previously applied energy as radio waves. These radio waves are picked up at different rates and signal intensities, depending on the tissue type releasing the energy. The waves are picked up by receiver coils in the MRI machine, which convert the energy to electrical signals. The computer uses these electrical signals to form an image.


There are two basic types of relaxation of protons (i.e., T1 and T2) that occur concurrently after the radiofrequency pulse is stopped; these types of relaxation are related to the return of the displaced net magnetic vector back to the direction of the static magnetic field (the positive z direction-T1 relaxation) and the loss of phase coherence among individual protons (T2 relaxation). Different tissues have different T1 and T2 relaxation times. Different tissues in the body have varying proton densities (i.e., number of hydrogen protons in a given volume of tissue), and the hydrogen protons in different tissues have varying levels of mobility. These tissue differences account for the variation in signal intensities generated by different tissue types in MR imaging (e.g., fat versus cerebrospinal fluid [CSF]). The variation in relaxation times between different tissues in the body is far greater than the variation in tissue density, thus, soft-tissue contrast resolution is superior in MR images compared to CT images.


T1 relaxation refers to the return of excited protons to the original energy state of the static magnetic field. Because this represents energy exchange between spinning high-energy protons and the molecular lattice from which they were excited, it is also called spin-lattice relaxation. Because this energy transfer occurs as the displaced net magnetic vector relaxes back to the z or longitudinal direction, it is also referred to as longitudinal relaxation.


T2 relaxation describes energy exchange between the magnetic fields of individual protons before and after the application of a radiofrequency pulse. It also includes energy exchanges between protons and local fluctuations in the static magnetic field. These magnetic field in-homogeneities tend to dephase proton spins, decreasing the potential signal that can be generated after an excitatory RF pulse. T2 relaxation is also called spin-spin relaxation. Because this type of relaxation occurs in a transverse direction (the x-y plane), it is also referred to as transverse relaxation. The phenomenon of T2 relaxation is primarily related to the loss of phase coherence among excited protons as they relax back to the equilibrium or ground state.


The time it takes for 64% of the protons in a particular tissue to regain the original energy state following the application of a 90° displacing radiofrequency pulse is that tissue’s relaxation time (T1 or T2). Water has a very long T1 and T2 relaxation time, whereas fat has short T1 and T2 relaxation times. On a T1-weighted image, water (e.g., CSF, edema) will appear dark (hypointense) and fat will appear bright (hyperintense). On a T2-weighted image, water will appear hyperintense and fat will appear slightly less intense when compared to fat in T1-weighted images. Generally, T2-weighted sequences have the most inherent contrast between the various soft tissues, and the majority of pathologic processes will be associated with an increased signal intensity on T2-weighted images. T1-weighted sequences tend to have better anatomic resolution when compared to T2-weighted images.


Besides T1- and T2-weighted sequences, there are many additional sequences commonly utilized in MR imaging. Proton density (PD) sequencing produces an image based on the density of protons within the tissue rather than T1 and T2 decays. The greater the density of protons, the more hyperintense that tissue contrast will be. Proton density images also tend to have good anatomy resolution. Fluid attenuation inversion recovery (FLAIR) sequences suppress the signal from free water (e.g., CSF) in order to discern this from tissue-bound water (e.g., edema), which has a considerably shorter T1 value. In neurologic imaging, FLAIR images are particularly helpful in distinguishing infarcts from cystic structures and delineating periventricular lesions as distinct from the neighboring ventricular CSF. Dual echo sequences combine the acquisition of a T2-weighted and PD images and are used to save time during the scanning process. There are two types of fat suppression sequences, the short tau inversion recovery (STIR) and a chemical fat saturation (FAT SAT). The physics behind these two suppression sequences are different. The important clinical difference between the two suppression sequences is that the physics associated with the STIR sequence will also suppress any gadolinium-based contrast enhancement. Contrast enhancement can still be appreciated with FAT SAT sequences. A fat suppression sequence is extremely important to utilize in musculoskeletal MR imaging in order to rule out fat deposition versus a pathologic process within the bone. A fat suppression sequence should be utilized in any clinical situation where signal from fatty tissues needs to be suppressed to discern other neighboring anatomy or confirm a pathologic process.


Gadolinium (Gd)-DTPA (diethylenetriaminepentaacetic acid) is a paramagnetic, intravenously administered contrast agent used in MR imaging. Similar to iodinated intravenous contrast administration in CT imaging, Gd-DTPA is used to demonstrate vascularity and abnormalities of the blood-brain barrier. Gd-DTPA shortens both T1 and T2 relaxation times of tissues in which it localizes, leading to greatest signal intensity on T1-weighted images.


Seldom are all of these sequences done in one MR exam. Usually several sequences are established for a standard imaging protocol tailored for a specific organ system, such as a brain, spine, generalized musculoskeletal imaging or a joint-specific protocol (e.g., shoulder or stifle). Each MR imaging protocol may vary slightly, being made by each specific practice and tailored to that MR imaging system. Each MR sequence requires an allotment of time to acquire that sequence. In veterinary medicine, the patient is under general anesthesia for MR imaging. Therefore, the typical goal with MR imaging is to have enough sequences and imaging planes to make an accurate diagnosis, without subjecting the patient to unnecessary or repetitive sequences and increased anesthesia time.


There are a number of other MR imaging sequences that are becoming increasingly utililized in veterinary medicine. These include phase-contrast or CINE-MRI and diffusion-weighted imaging (DWI). Phase-contrast or CINE-MRI utilizes motion-sensitive pulse sequences in order to evaluate CSF flow. This type of imaging has potential for application in abnormal CSF flow disorders such as Chiari-like malformation with syringomyelia. Diffusion-weighted imaging is based on MR measurement of the diffusion of intracellular water. With ischemic and inflammatory conditions of the CNS, cytotoxic edema leads to abnormalities of water diffusion (damage to ATPase pumps) that can be visualized via DWI. This mode of MR imaging is particularly applicable to ischemic/vascular events and inflammatory disorders, as abnormalities can be detected earlier in the disease course compared with conventional (e.g., T2-weighted, FLAIR) MR sequences. A variation of DWI called diffusion tensor imaging (DTI) or MR tractography, is used to evaluate white matter tracts via evaluation of the direction of water diffusion along these tracts (Fig. 15-1).


Computed Tomography (CT)


Computed tomography (CT) utilizes x-rays and computers to provide cross-sectional images of the patient. The final images are composed of many small image squares called pixels. The thickness of these image squares (voxels) is determined by the chosen slice thickness. The patient is placed in the opening of the CT gantry. The gantry contains the x-ray tube, x-ray collimators, and x-ray detectors. The x-ray tube and detectors are on opposite sides, and the patient is between them. The collimators control slice thickness. The x-ray tube rotates around an object of interest as x-rays are emitted. As the x-ray beam passes through an object, it is attenuated by tissues in its path. Each tissue attenuates the beam to a different degree. The different attenuating abilities of different tissues, or linear attenuation coefficients, provide the basis of tissue contrast for CT. The detector receives the attenuated beam, also called a projection, of x-ray photons, and the information is fed into the computer. The projections are reconstructed into a 3D volume by using either purely analytic methods like filtered back projection (the most common) or iterative procedures like expectation maximization (EM). The analytic approaches currently dominate; however, iterative methods perform better with less reliable information and will likely see increased usage as the desire to lower the applied radiation dose becomes more important. The computer assigns grayscale numbers (Hounsfield units) to the tissues that the x-ray beam passed through, based on their linear attenuation coefficients.


The resultant image reflects the different grayscale numbers of different tissue types, and therefore the tissues’ respective abilities to attenuate x-rays. As one would expect from conventional x-ray procedures, bone appears white, air appears black, and fluid is somewhere in between (gray). The corresponding Hounsfield numbers for these tissues are +1000, −1000, and 0, respectively.


The human eye can discern approximately 20 shades of gray. The number of shades of gray in the image, as well as the central gray color (above which tissues are brighter, below which they are darker) can be manipulated once the computer receives the image information. Choosing the central gray color, above which tissues appear brighter and below which they appear darker, is referred to as setting the window level (WL). The Hounsfield unit of the tissue of interest is typically chosen as the center of the window level. The number of shades of gray assigned to a particular image represents the window width (WW). A narrow window width is chosen for soft tissue (e.g., brain parenchyma) in order to improve contrast resolution (the ability to discern differences in composition of tissues in close proximity). A wide window width is chosen for tissues in which good inherent contrast already exists (e.g., air in the frontal sinus region) or when imaging a region where a wide range of tissue densities is displayed (e.g., lung). When imaging brain parenchyma, a WL of approximately 35 and a WW of 150 may be assigned. In contrast, when imaging bony tissue, a WL of 420 and WW of 1500 may be used.


After obtaining CT images of the area of interest, iodinated contrast is often given intravenously and the patient is imaged. The contrast agent will be distributed through the vascular space and excreted by the kidneys. Contrast is used to demonstrate areas of blood-brain barrier disruption, increased areas of vascularity, delineated blood vessels, and anomalous shunts. As the kidneys excrete the contrast, it quickly concentrates in the urine, which also allows for clear delineation of the ureters.


Advantages of CT over other imaging modalities are numerous. Computed tomography provides far superior soft-tissue contrast in comparison with conventional radiography. The various soft tissue planes are usually delineated with CT imaging. The cost of CT is typically less than MR imaging. Computed tomography is a more rapid imaging modality than MRI, and the mineralized bony matrix and acute hemorrhage are better visualized with CT versus MRI; these attributes make CT preferable to MRI in acute head trauma patients. Currently available multislice CT scanners are so fast that patients can be imaged in seconds, sometimes only requiring sedation. Other advantages of CT imaging are the ability to alter window settings after data acquisition to maximize tissue contrast. Following the initial data acquisition, modern CT has the ability to form multiple 2D and 3D reconstructed images. With newer CT scanners these reconstructed 3D images are very detailed and artifacts associated with metallic implants are usually not an issue unless precise quantification near the implant is required. The use of CT for postoperative assessment of implants is very efficient and much more detailed than conventional radiography.


There are several disadvantages of CT compared to MR imaging. Computed tomography involves exposure to ionizing radiation (x-rays), whereas MR imaging does not. Magnetic resonance imaging provides far superior soft tissue detail in comparison with CT. Computed tomography is usually adequate for visualizing mass lesions in the brain and spinal cord. However, subtle parenchymal lesions (e.g., inflammatory foci in granulomatous meningo-encephalomyelitis [GME]) as well as brain (especially brain stem) and spinal cord lesions in very small dogs and cats are much more appreciable on MRI than CT.

Stay updated, free articles. Join our Telegram channel

Sep 11, 2016 | Posted by in SMALL ANIMAL | Comments Off on Advanced Imaging for Surgeons

Full access? Get Clinical Tree

Get Clinical Tree app for offline access