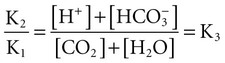
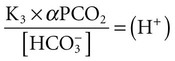
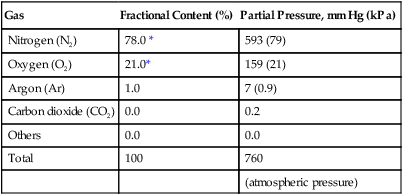
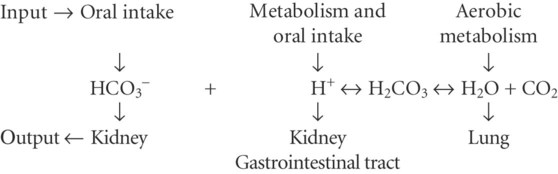
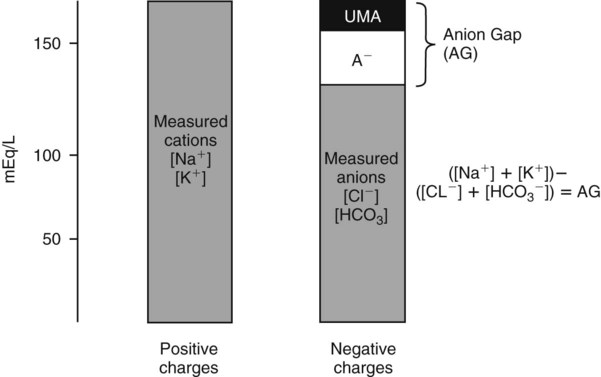
Conventional approaches to the diagnosis of acid-base disorders are based upon the interpretation of changes in blood pH, carbon dioxide partial pressure (PCO2), and bicarbonate Acid: A substance that can donate a hydrogen ion (H+): Carbonic acid (H2CO3) donates H+ Actual bicarbonate: The amount of bicarbonate Anion gap: The total number of cations in the extracellular fluid equals the total number of anions; however, not all anions and cations can be measured. This means that there is an apparent “gap,” or difference, between the number of cations and the number of anions. This gap is the anion gap (AG). The AG represents the difference between unmeasured cations and unmeasured anions, the AG is mostly a result of the net negative charge on proteins, and is heavily influenced by protein concentration and is calculated as (Fig. 15-2) ATOT: Total concentration of weak acid; in plasma these consist of albumin and inorganic phosphate; increases in ATOT (weak acids) can cause metabolic (nonrespiratory) acidosis; decreases in ATOT cause metabolic alkalosis Base (B): A substance that can accept a hydrogen ion (H+) Base excess (BE): The amount of base above or below the normal buffer base, expressed in milliequivalents per liter (mEq/L), in blood; positive values (+) reflect an excess of base (or deficit of acid), metabolic alkalosis; negative values (−) reflect a deficit of base (or excess of acid), metabolic acidosis Buffer: A mixture of substances in a solution that resists or reduces changes in hydrogen ion concentration (changes in pH); important buffers in the body include hemoglobin (Hb) and bicarbonate Components of Buffering in Blood Free water: Water without electrolytes (pure H2O); increases in plasma free water dilute plasma constituents causing dilutional acidosis; decreases in free water concentrate plasma constituents result in alkalosis Partial pressure: The pressure an individual gas exerts on a column of mercury; expressed in millimeters of mercury (mm Hg); 1 kPa = 7.50 mm Hg; see the following example of gaseous components of air *Partial pressure of water (PH2O) varies according to humidity and has a proportionate effect on partial pressure of oxygen (PO2) and partial pressure of nitrogen (PN2). 1 kPa = 7.5 mm HG pH: The negative log of the hydrogen ion (H+) concentration; the pH is inversely proportional to the log of the H+ concentration (see Fig. 15-1) Strong ion: A salt that is completely dissociated in water (e.g., Na+, K+, Cl−, Ca2+, Mg2+) Strong ion difference (SID): The difference between the sums of the positive (cations) and negative (anions) strong ions; normally (Na+, K+, Cl−); increases in SID usually cause metabolic (nonrespiratory) alkalosis; decreases in SID usually cause metabolic (nonrespiratory) acidosis Abnormalities in Strong Ion Difference (SID) and Total Concentration of Weak Acid (ATOT) Strong ion gap: Because homeostasis derives from charge balance, SIDa (apparent SID) must be counterbalanced by an equal and opposing charge termed the effective strong ion difference (SIDe). The SIDe negative charge principally stems from the dissociated moieties of plasma proteins (~78% albumin) and phosphate (~20%). The sum of these weak acids is known as ATOT because they exist in a dissociated form (A−) as well as an associated form (AH). When the SIDa and SIDe are equal, the plasma pH is exactly 7.4 at a PCO2 of 40 torr. When the SIDa and SIDe are unequal, the difference between the two is termed the strong ion gap (SIG) (SIDa–SIDe, normal = 0; Fig. 15-3). This value cannot be determined by examination of other acid-base variables or schemes, and is buried within the AG along with A− and lactate. Total CO2 content: The amount of carbon dioxide gas extractable from plasma; total CO2 consists of: Unmeasured anions: Strong ions (anions) that are not routinely measured (e.g., lactate; PO42+, SO42+) II Many factors influence an animal’s acid-base balance B Diet (carnivorous versus herbivorous) E Concentration of “strong” ions or salts that completely dissociate in water (e.g., Na+, K+, Cl−, lactic acid) III Normal cellular metabolism continuously produces an excess of hydrogen ions, the concentration of which is regulated and eliminated by the lungs, kidneys, and gastrointestinal system to maintain an extracellular pH of approximately 7.4 A The kidneys eliminate hydrogen ions by excreting fixed acids and reabsorbing B The lungs reduce plasma hydrogen ion concentration by eliminating CO2 C The kidneys and gut participate in regulating pH by modulation of acid (HCl), base (Na+, IV Substances within the body known as buffers (see earlier table, Components of Buffering in Blood) help minimize changes in pH (e.g., hemoglobin, V Determination of pH and blood gases is useful in determining the animal’s acid-base status and severity of any imbalance I The waste products of oral intake or metabolism (aerobic or anaerobic) are mostly acidic substances that release hydrogen ions A Volatile acid: an acid that produces a gas B Nonvolatile or fixed acids: acids that cannot be converted to gas II The pathways for acid removal include the kidney, lung, and gastrointestinal tract A High-protein diets (cats, dogs, pigs, humans) B Diets high in plant material and grain have C Based on primary dietary intake 1. Carnivores have acid urine or excess acid to excrete (pH: 5.5 to 7.5) 2. Herbivores have excess base to excrete (pH: 6 to 9) and produce alkaline urine and saliva D Dietary and metabolic intake of acid or base equals the urinary and respiratory output, thereby maintaining the pH of the body fluids near 7.4 E Many approaches to the diagnosis and treatment of acid-base disorders are based on the following (Henderson-Hasselbalch equation):
Acid-Base Balance and Blood Gases
Overview
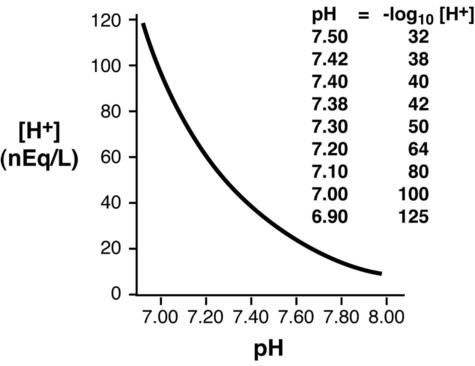
 or base excess concentration. Base excess is defined as the amount of strong acid that must be added to each mL of fully oxygenated blood to return the pH to 7.40 at a temperature of 37° C and a PCO2 of 40 mm Hg (5.3 Kilopascal [kPa]). Changes in blood pH signal either an increase (acidemia) or decrease (alkalemia) in hydrogen ion concentration and when combined with changes in PCO2 concentration (PCO2/pH relationship) permit the recognition of primary acid-base disturbances and the identification of respiratory and/or metabolic (nonrespiratory) disturbances (Fig. 15-1). Alternatively, the diagnosis of acid-base disorders may be determined by changes in so-called independent variables (Stewart’s approach), which includes PCO2, strong ion (e.g., Na+, K+, C1−, Ca+2, Mg+2) difference, and the total concentration of nonvolatile weak acid (ATOT). The aforementioned independent variables are responsible for determining the dependent variables pH and
  . From a clinical standpoint, both approaches succeed in identifying acid-base disorders, although the latter (Stewart’s approach) is more enlightening, especially when mixed acid-base and electrolyte disorders co-exist. Evaluation of an animal’s acid-base status is useful for determining disease severity, diagnosing the disease, and formulating therapy.
General Considerations

 expressed in milliequivalents per liter of plasma


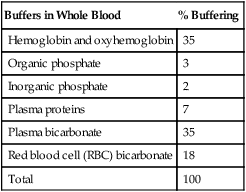
Buffers in Whole Blood
% Buffering
Hemoglobin and oxyhemoglobin
35
Organic phosphate
3
Inorganic phosphate
2
Plasma proteins
7
Plasma bicarbonate
35
Red blood cell (RBC) bicarbonate
18
Total
100
Gas
Fractional Content (%)
Partial Pressure, mm Hg (kPa)
Nitrogen (N2)
78.0 *
593 (79)
Oxygen (O2)
21.0*
159 (21)
Argon (Ar)
1.0
7 (0.9)
Carbon dioxide (CO2)
0.0
0.2
Others
0.0
0.0
Total
100
760
(atmospheric pressure)


SID
Increased
Metabolic alkalosis
SID
Decreased
Metabolic acidosis
ATOT
Increased
Metabolic acidosis
ATOT
Decreased
Metabolic alkalosis


 ), and water excretion
 ,
,  , Prot−)
Formation and Elimination of Acids and Bases in Animals

 excess from salts in:

 is matched by an increase in chloride, the AG does not change; the acidosis is classified as hyperchloremic or normal AG acidosis. If the decrease in HCO3 is not accompanied by an increase in chloride concentration, the acidosis is due to the addition of unmeasured anions (e.g., lactic acidosis).
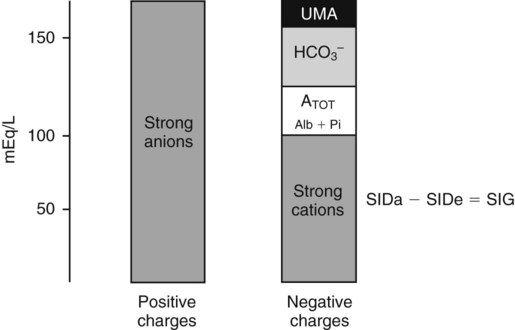
 , albumin, globulins, and phosphate. The SIG accounts for the differences between strong cations and strong anions. The simplified SIG can be estimated using albumin concentration and AG:
 )
)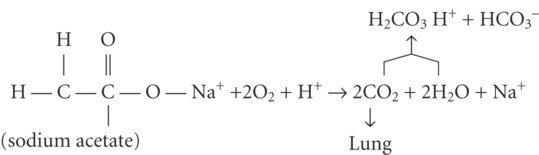
 after metabolism
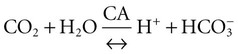 (carbonic anhydrase [CA])
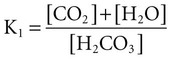 (K; the dissociation constant for each acid)