Fig. 1
Tools to dissect and mount the vessels into the wire myograph. The small petri dish contains 2-cm-long wires. The blue mark on the petri dish marks a length of 2 cm to facilitate cutting the wires
3.
Wires of 2 cm in length and either 40 μm of diameter (for arteries between 200 and 1000 μm) or 25 μm of diameter (for arteries with inner diameters less than 200 μm) (Fig. 1).
4.
Wire myograph (e.g., Multi Wire Myograph System, Model 620M, Danish Myo Technology, DMT) (Fig. 2) (see Note 2 ).
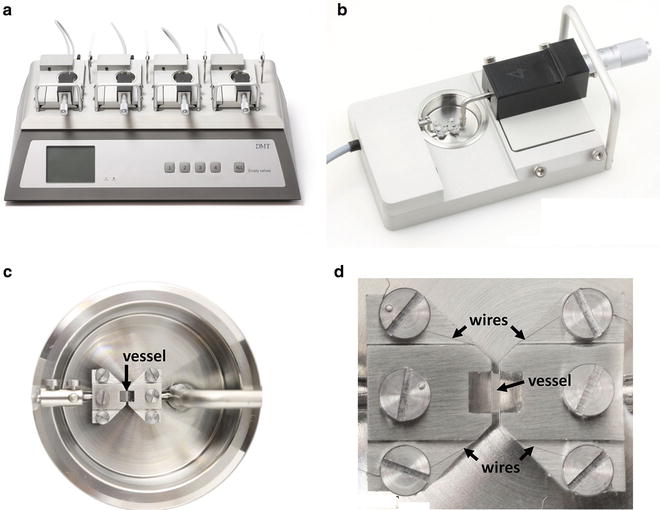
Fig. 2
The wire myograph. (a) DMT multi-chamber 620M Wire Myograph. The wire myograph interface holds four myograph units. (b) Each myograph unit contains a force transducer (left) and a micrometer (right), which are both connected to corresponding jaws to support the vessel inside the chamber. (c) Detail of the chamber with the jaws and a mounted vessel segment. The upper and lower jaws are connected to the micrometer screw and to the force transducer, respectively. (d) Detail of the jaws, screws, wires, and a mounted vessel segment. Adapted from www.dmt.dk with permission from Danish Myo Technology A/S
8.
Krebs–Henseleit (KH) solution: 115 mM NaCl, 2.5 mM CaCl2, 4.6 mM KCl, 1.2 mM KH2PO4, 1.2 mM MgSO4, 25 mM NaHCO3, 11.1 mM glucose, and 0.01 mM EDTA (see Note 6 ).
11.
Saturated KCl solution (4.61 M at 20 °C).
12.
Acetylcholine. Prepare stock solutions: 0.1 μM, 1 μM, 10 μM, 0.1 mM, 1 mM, and 10 mM, dissolved in KH solution.
13.
Phenylephrine or norepinephrine. Prepare stock solutions: 0.1 μM, 1 μM, 10 μM, 0.1 mM, 1 mM, and 10 mM, dissolved in KH solution (see Note 9 ).
15.
Accessories for analyzing responses to electrical field stimulation: electrical stimulator (e.g., CS14-4BO, Cibertec), plastic mounting jaws, and connecting cable for the wire myograph (they should be mounted in each channel before mounting the vessels).
3 Methods
3.1 Vessel Dissection
2.
Euthanize mice by CO2 inhalation.
6.
Cut the artery into ~2-mm-long segments.
7.
9.
If desired, remove the endothelium (see Note 17 ) as follows:
(a)
For mouse aorta: place the artery segment on a paper tissue, and let the inner walls touch. Pull the artery with a piece of absorbent laboratory countertop paper, making the segment roll throughout one turn, and place the artery again in cold KH solution.
(b)
For smaller vessels: introduce a thin stick or even a human hair through the arterial lumen and gently rub the luminal surface [9].
3.2 Vessel Mounting
1.
Switch on the wire myograph.
2.
Fill in the chamber with 5 mL of KH solution.
4.
Put 500–600 mL of KH solution in the heated bath and continuously bubble it with carbogen. This buffer will be used to wash and refill the chambers during the experiment.
6.
Cut a 2-cm-long wire and pass it through the lumen of the artery segment minimizing contact with the artery wall.
7.
Take the wire with the artery and place it into one of the chambers of the myograph, between the two jaws, alongside the space for the artery (Fig. 3a).
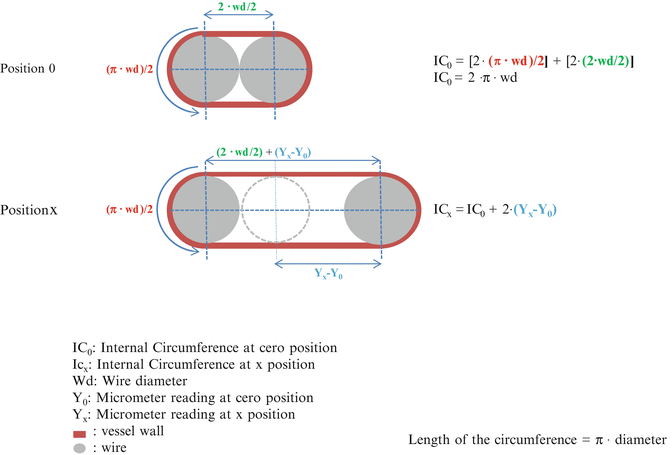
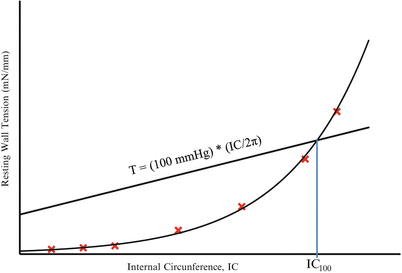
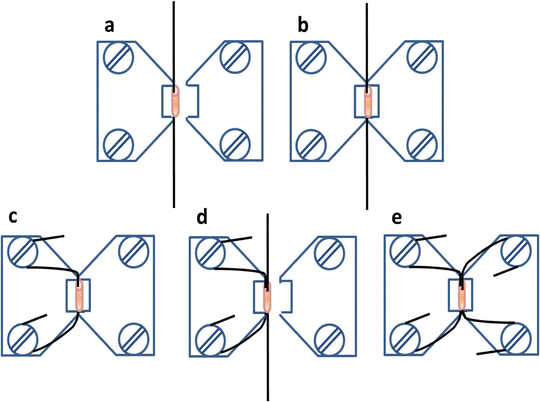
Fig. 4
Procedure to calculate the Internal Circumference. The diagram shows how to measure the length of the internal circumference of the artery mounted on the wire myograph. The DMT normalization module of LabChart automatically calculates it according to these principles. See details in Note 22
Fig. 5
Curve fitting for the determination of IC100. Internal Circumference (IC) corresponding to an effective pressure of 100 mmHg (IC100) is estimated by the insertion point of the exponential fitting curve of the different points on the normalization procedure and the isobar at 100 mm Hg according to the Laplace´s equation. This curve and the IC100 value is automatically plotted and calculated during the normalization procedure by the DMT normalization module of LabChart, which gives the micrometer reading value in which the artery should be set to perform the experiment. See details in Note 22
8.
Clamp the wire with the jaws by moving the jaws closer (Fig. 3b). One of the jaws is fixed and connected to the force transducer, and the other is mobile. The distance between the jaws can be changed with a micrometric screw connected to the mobile jaw. Let the jaws come together to clamp the wire.
9.
10.
Separate the jaws and carefully insert another 2-cm-long wire through the lumen of the artery minimizing contact with the wall (Fig. 3d).
11.
Clamp the second wire by moving jaws together again. Wrap clockwise and clamp the second wire to the screws of the second jaw (Fig. 3e).
12.
Move away the wires so that they are as close to each other as possible but not touching.
13.
Place the chamber into its place in the wire myograph and plug the transducer cables into the back of the wire myograph.
15.
Cover each channel with its chamber cover, put the plastic funnels, and wait for 30 min approximately to allow stabilization of the vessels and bath heating before starting the normalization protocol.
3.3 Normalization
3.
Press the “Start” button on the “Chart View” window to run the experiment and start recording. Save the experiment as a “LabChart data file,” with a new name to avoid overwriting the original settings file (see Note 24 ).
4.
Move very slowly the jaws together until the wires just touch. At this point, the force displayed on the wire myograph will suddenly fall to a negative reading (see Note 20 ). Then slightly move the jaws apart to just separate the wires. This position corresponds to the zero force point where the artery wall is not subjected to any force.
5.
In the myograph display, set the chamber force to the zero point. Force recorded in the LabChart should automatically change to zero.
6.
In LabChart, press the “DMT” flap, go to “Normalization Settings,” and fill the boxes as indicated below:
(a)
“Eyepiece calibration (mm/div)”: 1.
(d)
“Online averaging time (seconds)”: 2.
(f )
The window also offers the possibility of playing a sound when the delay time has been completed.
7.
Press the “OK” button on the “DMT Normalization Settings” window. The window will close.
8.
Click the “DMT” flap and select the channel of interest. The normalization window for the channel will open (channel 3 in the example of Fig. 6). Fill in the boxes for the constant values (see Note 28 ):
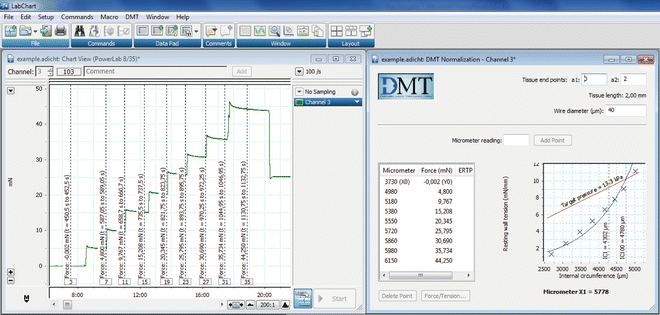
Fig. 6
Example of output recordings during the normalization procedure. Left: The Chart View window shows the force recordings along the time in one channel. Right: The DMT Normalization window shows the data of force and micrometer readings, and also plots the automatically-calculated internal circumference and resting wall tension data. When the artery has reached the tension corresponding to the target pressure of 100 mmHg (13.3 KPa), the program gives a definitive Micrometer X1 value. The artery is then set to the distension corresponding to the Micrometer X1 value (IC1 = 0.9 · IC100). The software used is LabChart 7 from ADInstruments. Reproduced with permission from ADInstruments
(a)
“Tissue end point a1”: 0
(b)
“Tissue end point a2”: 2
(c)
“Wire diameter (μm)”: 40
9.
Introduce the actual micrometer reading value in the box and press “Add Point.” This first value is the zero point, the first point of the exponential fitting curve for normalization. Wait for the 60-s delay until the program records the force measurement corresponding to the first point, which should be close to zero. After this time, the box for “micrometer reading” values becomes active again (Fig. 6).
10.
Slightly stretch the vessel by moving jaws apart until you see an increase in the force in the wire myograph display (see Note 29 ). Introduce the value of the micrometer in the box and press “Add Point.” Wait for the 60-s delay time.
11.
12.
Set micrometric screw to the “Micrometer X1” value.
13.
Change KH solution buffer on each chamber. Wait for 15 min before starting to induce vasomotor responses in order to let the arteries stabilize at their new distension.
3.4 Assessment of Vessel Viability (See Note 31 )
An example of the output recordings for a contractile response to KCl is shown in Fig. 7.
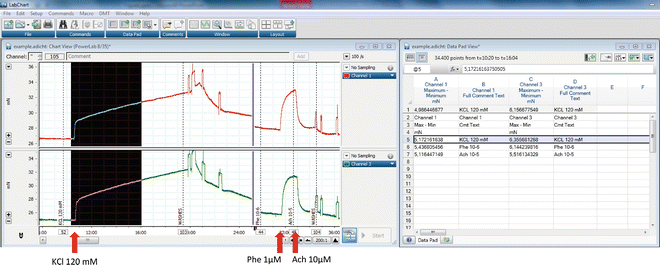
Fig. 7


Example of output recordings during the assessment of vessel viability and endothelium integrity. Left: Chart View window showing the force recordings along the time in two channels. Vertical dotted lines correspond to comments that are entered by the operator to indicate the substance added before any induced vasomotor effect. Shown from left to right are the contraction induced by 120 mM KCl, the relaxation after washes, the precontraction induced by 1 µM phenylephrine (Phe 10-6), and the relaxation induced by 10 µM acetylcholine (Ach 10-5). Right : Data Pad View window showing data measurements in each channel and the corresponding comments. The black area in the chart window shows the raw data selected to calculate the maximum-minimum force values in the Data Pad. Corresponding counted values are in the row highlighted in grey in the Data Pad view. The software used is LabChart 7 from ADInstruments. Reproduced with permission from ADInstruments
Stay updated, free articles. Join our Telegram channel
Full access? Get Clinical Tree
