Fig. 1.
Schematic representation of tissue cutting and embedding for the whole brain. Section A is for detecting the histological changes of middle cerebral artery (MCA) and anterior cerebral artery (ACA). Section B is for measuring basilar artery (BA) cross-sectional area. The lower panel shows the ventral and dorsal images of Section A of the upper panel. Three cuts were made in this section of the brain for obtaining perpendicular sections of the MCA and ACA, respectively. The arrows indicate slice direction.
Sections are put in cassettes and embedded in paraffin using standard methods.
Sections 7–10 μm thick are cut on a microtome.
3.3 Hematoxylin and Eosin Staining
Place slides with sections on them into a staining rack.
Sections are deparaffinized in xylene and rehydrated through a decreasing gradient of ethanol solutions (100–70%).
Slides are stained with hematoxylin and eosin and coverslipped with xylene-based mounting medium.
3.4 Light Microscopy or Slide Scanning
Place the slide on the microscope stage, with the coverslip facing the source of light.
Adjust magnification to 20–25 times (taking into account internal camera magnification).
Locate the artery of interest (BA, MCA, or ACA).
Take photos with microscope camera and save in tagged image file format.
Alternatively, use a slide scanner that will scan the specimens onto an optical disc. For these systems, the software program usually allows viewing the specimen on the computer, taking pictures and adjusts scale magnification automatically.
3.5 Assessing Vasospasm
Most image analysis software can perform this task, one of the most common measuring softwares is Image J (available free from the NIH).
Open Image J and drag and drop image onto the Image J tool bar.
Adjust and measure scale bar, by drawing a line across the scale. Subsequently, go to edit option on the toolbar 6 adjust scale bar 6 and write down the length of the scale bar (2–3 cm) corresponding with the pixel dimensions.
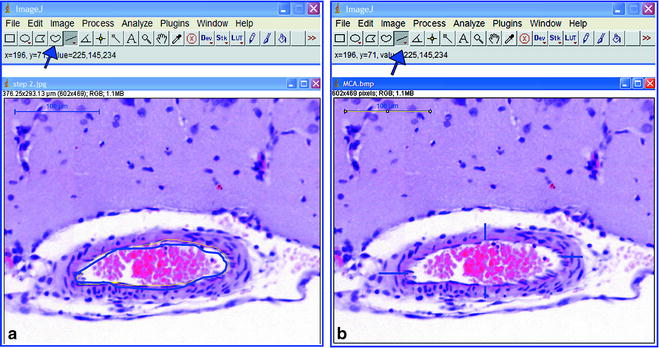
Click on the free-style line icon, and draw along the lumen of the artery under high magnification. An alternative method would be utilizing the magic tool, which automatically selects the lumen area accurately, if enough contrast is seen in the image.
Alternatively, the perimeter is calculated initially in a similar fashion to the measurement of area. The area of the artery and its radius (area = πr 2, where r = radius) are calculated from the perimeter value (2πr) that are measured with image J. This alternative method provides an accurate approximation of the lumen areas as it would correct for potential errors in vessel deformity. If the artery is not sectioned perpendicular to its long axis, however, errors could occur.
Click Ctrl + M, and a new window will open up with the measurements of the lumen area/perimeter in microns (Fig. 2, one can repeat the step three times and take the average for an accurate assessment).


Fig. 2.
Assessment of cross-sectional area and wall thickness. (a) Free style icon is used to demarcate the luminal area of the vessel in order to measure lumen circumference and area (after scale-bar standardization). (b) The straight line icon is used to measure the thickness of the artery wall at four points around the circumference.
To measure the thickness of the wall, select the straight line icon and draw a line from the endothelial layer 6 tunica media and usually not the adventitial layer (which could be irregular and not accurately sectioned due to the fragility and variability of the connective tissue). Repeat in four different regions, adjacent to each other (90°) (Fig. 2).
Select all the data in the data viewer, copy and paste into a spreadsheet. Perform analysis, by measuring the mean of the lumen area in all samples—the standard deviation or standard error and the average of all four measurements of the wall thickness.
Data can be expressed as separate graphs or one graph depending on what the researcher wishes to convey. Two separate graphs can be used to depict lumen diameter or cross-sectional area and another as wall thickness. If there are appropriate controls, this would demonstrate vasoconstriction/vasodilation as well as wall remodeling. Another way to show the data would be wall thickness/lumen diameter which increases with increasingly severe vasospasm.
4 Advantages and Disadvantages of Cross-Section Measurements for Vasospasm
Advantages of assessment of vasospasm based on cross-section measurements of fixed arteries are that it is simple and commonly used. Thickness and cross-section area of different layers of the artery wall can be obtained and other immunohistochemical studies carried out. A wide range of arteries based on the location of hemorrhage can be measured.
< div class='tao-gold-member'>
Only gold members can continue reading. Log In or Register to continue
Stay updated, free articles. Join our Telegram channel

Full access? Get Clinical Tree


