CHAPTER 111 Using Statistical Process Control to Investigate Reproductive Failure in Swine
You are called by a producer who is alarmed that the farrowing crates are half empty this month. What should he do? Another producer calls to report yet another abortion. Should he vaccinate? A third producer calls: She has noticed an increase in the number of returns to service. What should she do?
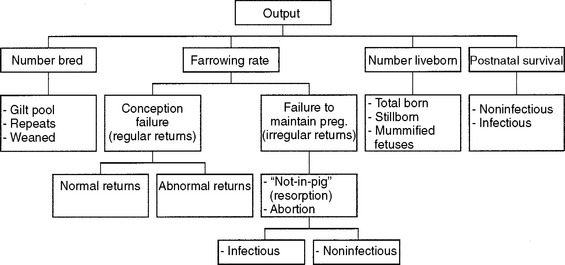
For example, one might be presented with a low farrowing rate; that is, a lower than expected percentage of sows that were apparently bred are farrowing. To investigate this case, the diagnostician must first know what the expected farrowing rate is for this herd. Assuming a “real” decrease has occurred, the diagnostician then must determine if the sows were actually bred and whether they conceived, and, assuming they conceived, why they did not farrow (Fig. 111-1). A relatively simple-appearing clinical situation quickly becomes complex. The case is further complicated if the producer lacks detailed reproductive records (arguably, without good records, the case is simple—it is unsolvable).

APPROPRIATE DECISION MAKING: WHEN IS A SYSTEM OUT OF CONTROL?
Epidemic Reproductive Failure
In our experience, epidemics of reproductive failure are more likely to be caused by a single infectious agent such as PRRSV or porcine parvovirus. A sudden, but less dramatic, decline in reproductive performance may be associated with epidemics of infection due to pseudorabies virus, transmissible gastroenteritis virus, or swine influenza virus. These latter cases of mild but significant reproductive failure also may be caused by a variety of bacteria, including Leptospira spp. Diagnostically, submission of appropriate samples from a herd epidemic is likely to be very revealing if an infectious agent is involved.
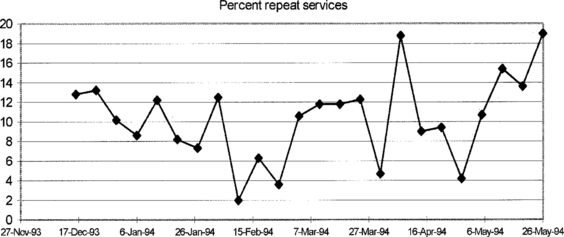
A run chart is a type of line graph on which time is on the x-axis and the variable of interest is on the y-axis (Fig. 111-2). Run charts are very easy to compose and allow quick interpretation of trends. However, it is difficult to differentiate between random fluctuations and early, mild trends in the data. Therefore, another type of chart called a control chart was developed.
The control chart, like the run chart, plots the actual values over time but also considers the recent variation while estimating control limits (Fig. 111-3). Control limits are calculated by adding and subtracting three standard deviations to the average value. A critical step in using control charts is to start with a process that is “in control” to determine the expected standard deviation. Using these expected standard deviations, if the number of returns to service per unit of time is beyond the upper or lower control limit, one can be extremely confident that the process is “out of control.” At this point, the consultant must intervene and initiate a diagnostic investigation.
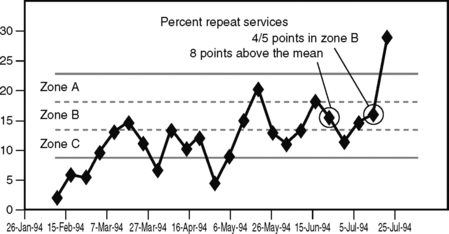
Control charts can be further modified to create an “early warning system.” That is, the area between the average and the control limit can be subdivided into three zones based on standard deviations (see Fig. 111-3). Zones C, B, and A correspond to the average ±1, ±2, and ±3 standard deviations, respectively. If the measurement of interest is normally distributed around the average, then data points should appear approximately normally distributed within the limits. Also, there should be no evidence of trends or recurring cycles. Approximately 66% of the measurements should be in zone C. Approximately 95% of the measurements should be in zone B or C, and 99% of them should be in zone A, B, or C. Therefore, only 1 out of 100 times will a measurement be expected to be outside the control limits by chance alone. In other words, if a measurement occurs outside the control limits, one can be very confident that something has disrupted the process. The zones also can be used in conjunction with statistical probability to establish some guidelines that will detect a process out of control sooner than waiting for the control limit to be surpassed.1 The detection criteria are as follows:
Stay updated, free articles. Join our Telegram channel

Full access? Get Clinical Tree


