Method
Description
Optical Fractionator
Used to estimate the number of objects in a given region of interest; uses fractionator sampling methods with the Optical Disector
Physical Fractionator
Used to estimate the number of objects in a given region of interest; uses fractionator sampling methods; the counting frame and rules determine which objects are counted
Nucleator
The intersection of rays with the cell surface at a focal plane in which the nucleus is in focus, is used to estimate the volume (or cross-sectional area at this focal plane) of the cells
Cavaleri Estimator
Estimates the volume from cross-sectional area, employing Cavaleri’s principle
Counting neurons is one of the most common uses for stereology. For example, this study used stereology to assess the difference in the numbers of neurons in the somatosensory cortical barrels (Fig. 1) of young adult mice (2). Stereology not only provided a method for estimating the cell numbers and difference between treatment groups but also allowed for the determination of volume changes in the given barrel subfields. Stereology may be used for assessing the number of neurons in the human brain postmortem. One study investigated the number of neurons in the hippocampus and investigated age-associated alterations (3).
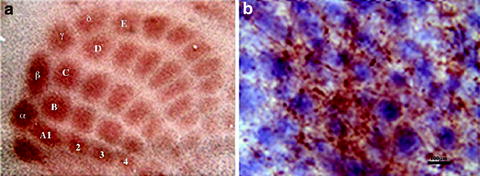
Fig. 1.
The 5-HT thalamocortical fibers and the differential NeuN + barrel neurons in the barrel field (a) is a representative photomicrograph of the 5-HT (brown fibers)/NeuN (blue–black nuclei) double labeling at ×5 magnification; (b) is a section at ×100. Scale bar = 100 μm. (From ref. (2): Reprinted with permission from Elsevier).
2.1.2 Quantifying Neuronal Terminals
As an alternative to purely counting neurons, one may choose to study neuronal terminals or varicosities. Stereology was used to count the vesicular glutamate transporters and tyrosine hydroxylase-immunostained terminals in a study investigating the effect of chronic or repeated deprivation of alcohol on the dopamine (DA) and glutamate (GLU) terminals in the extended amygdala (4). Immuno-staining for tyrosine hydroxylase (TH) labeled DA terminals, and vesicular glutamate transporter 1 (vGLUT1)/vesicular glutamate transporter 2 (vGLUT2) labeled GLU terminals, which delineated regional boundaries of subdivisions in the extended amygdala due to their innate expression. The heterogeneous distribution of TH, vGLUT1, and vGLUT2 within a brain region rendered a unique challenge for stereological sampling, but it emphasizes that stereological analyses remain valid even though regional variation exists in terms of intensity or distribution of the signals. Figure 2 reveals the heterogeneous distribution of TH+ terminals in the shell of the nucleus accumbens, septum, and anterior commissure. Heterogeneous distributions require more sampling for analysis than a homogeneous distribution, for any given level of precision in the final estimate.
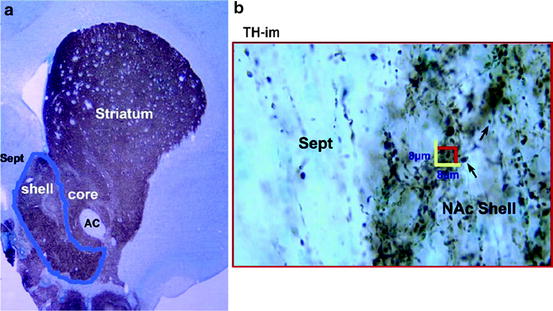
Fig. 2.
Stereological analysis of dopamine (DA) terminals in the shell of nucleus accumbens (sNAc). The DA terminals indicated by tyrosine hydroxylase-immunostaining (TH-im) are shown in the sNAc outlined using a computer-assisted stereology program (MBF Bioscience, Inc.) (a). The program generates randomly sampled frames within the drawn boundary (in b). The TH-im varicosities or bouton en passé (arrows) in the sampled frames were counted under a ×100 objective lens (in b). The varicosities inside the frame or on the green line are counted, and the total number or the density of the terminals is calculated according to the volume recorded. AC anterior commissure, Sept septal nucleus. Scale of frame: 8 × 8 μm. (From ref. (4): Reprinted with permission from Elsevier).
2.2 Combined Analyses
Neuroscience methods may be combined to use some of the available options packages contained in many stereology software packages. Stereo Investigator features tight integration with the Olympus DSU spinning disk confocal microscope (in addition to many other microscope models, including Zeiss microscopes with the ApoTome) and allows for easy acquisition of brightfield, widefield fluorescent, or multichannel fluorescent image stacks. In a study on retinal ganglion cell ocular hypertension, confocal images stacks of N-methyl-d-aspartate receptor 1 (NR1) and glutamate receptor 2/3 (GluR2/3) fluorescent immunostaining were obtained from confocal laser scanning microscope, quantified using stereology, revealing alterations in glutamate receptor expression (5). Additional discussion on 3D volume analysis is available in Section 7.
3 Practical Considerations in Using Stereology
3.1 Less Regional Variation and Increased Sampling Efficiency
The concern with traditional section-by-section “2D” (thin sections) counting methods is the presence of several inherent biases. The main problems with “2D” counting and sampling include determining what and how many sections to sample and defining representative sections as well as regions of interest. What to sample refers to maintaining regional consistency throughout the sections sampled, which may be established by anatomical or regional landmarks aided by immuno- or counter-staining. A stereological analysis of the number of serotonin (5-HT) neurons in the dorsal and ventral raphe (6) exemplified the importance of regional consistency, yet it points out that regional sampling has some caveats. Both stereology and manual counting were performed and compared (MR, DR, Fig. 3). In this case, blood vessels, which surround the raphe throughout the sections, provided an appropriate anatomical boundary (Fig. 3a, b arrows).
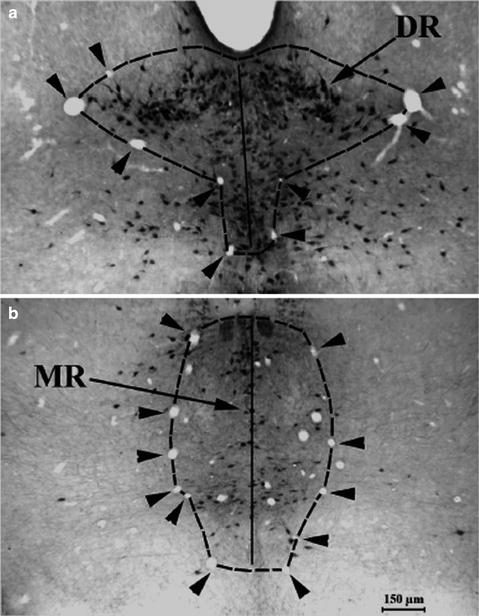
Fig. 3.
Microscopic photographs show that two groups of blood vessels supplying the brainstem raphe reliably outline the dorsal and median raphe nuclei. A symmetrical contour from the midline was drawn for the dorsal (DR, a) and median raphe (MR, b) (arrowheads) for stereological counting. Bar 150 μm. (From ref. (6): Reprinted with permission from John Wiley & Sons).
After defining the ROI, the Stereo Investigator program (and some, but not all others) provides an automated, systematic, and unbiased means to estimate the sampling population within the ROI. Stereology programs should take into account user preferences for the sampling fraction (these are normally determined in a pilot study):
1.
The section interval desired to count from each animal (this determines the proportion of sections through the ROI to be sampled).
2.
The spacing of the counting frames per section, known as the grid size (this determines the proportion of the cross-sectional area sampled). The number of sampling sites per section will vary with the size of the ROI on each section and the random start point—it will normally be a different number of sampling sites on each section.
3.
The disector height and guard zones sizes (this determines the proportion of the section thickness that will be sampled).
The program then automatically and randomly provides the number of counting frames, which will normally vary somewhat from section to section. If an exhaustively sectioned ROI would lead to too many sections, greater than 50 for example, being able to sample a subset, e.g., every third or fourth section, rather than a higher sampling interval can improve efficiency significantly with minimal impact on the precision of the resulting estimates. The number of sections sampled impacts the coefficient of error (CE), which reflects variability in the estimated mean (7). Differing levels of precision may be needed for any given study, thus viable CE values may vary significantly. Manual counting on the other hand, using non-stereological methods (whether exhaustive or not), would potentially require counting all signals in every section. This may be impractical, as well as yielding incorrect results, where counted objects cross between adjacent sections (even if only a subset of sections were counted, the math extrapolating to the final estimate will overestimate by the same amount as if exhaustive cell profile counting was performed on all sections). Non-stereological sampling in manual counting may introduce a number of potential selection biases; for example, in a case where a user counts every fourth section without a random offset, it is easy to inadvertently choose more completely stained sections and/or only sample at sites which are not truly “statistically representative” within the ROI.
3.2 Increased Reliability and Validity
Problems defining the ROI and counting parameters may influence total cell counts and volume estimation. Reliability and validity of cell counts or density measurements represent another bias present with “2D” manual counting (7). This means that another counter who repeats the same counting parameters and sampling would arrive at a similar result. Stereological counting incorporates the depth of a section, which provides additional information about the volume of the selected area, whereas manual counting has limits in these properties. In stereological counting, the optical disector and fractionator, central components in stereology, have less bias in assessing the number of the neurons within a section, but are subject to sampling and estimation. Stereology protocols also require careful attention to full antibody or counterstaining penetration throughout the entire section thickness, something that is equally critical, but often neglected when using other counting methods.
3.3 Controls for Incomplete Immunostaining
The depth of penetration of the antibody and counterstaining into the tissue or lack thereof results in another counting bias. Non-stereological counting, due to the limited attention to the z-axis depth, will normally underestimate the number of cells when facing incomplete staining through the section thickness. With stereology, the section thickness and z-axis depth are sampled, which relies on the ability to detect the immunostaining or counterstaining throughout the entire section thickness, even though the actual post-processed section thickness may be thinner than cut at the microtome. Under such conditions, the total number of cells will not be underestimated with proper staining. Several factors discussed below influence antibody penetration.
Antibody penetration may be influenced by tissue fixation, cutting thickness, use of detergents such as Triton X100 to increase penetration, and the incubation time and method (e.g., free floating vs. slide mounted). For all staining methods, penetration issues can be a confounding factor for using the optical disector in stereology (8). One aspect not mentioned in this study (8) is that one needs to have optimized their immunostaining protocols and system, while taking the limitations of immunostaining into consideration.
3.4 Influences of Tissue Processing
The method chosen to cut tissue may influence several factors that are important for stereology. The issues to be concerned about are antibody penetration and z-axis shrinkage. Z-axis shrinkage alters the distribution of cells depending on the fixation and cutting method used (9). According to the study, vibratome, paraffin, and glycolmethacrylate plastic sections have higher cell densities at the top and bottom of sections due to shrinkage, but have a central valley region with fewer cells. Celloidin sections, tissue embedded in a nitrocellulose solution and cut on a sliding microtome, had minimal z-axis distortion. Cryosections, on the other hand, bulged more at the center with less cell density at the top and bottom (9). Further studies are needed to confirm these results when replicated by other investigators.
Cutting tissue inadvertently causes another bias present in manual counting. Parts of cells at the top or bottom of the section may be cut off during cutting. This phenomenon, known as “lost caps,” causes underestimation of the population (7). Stereology corrects for “lost caps” by requesting users to specify a guard zone at the top and bottom of the section that is not counted (see Methods below). Appropriate guard zone sizes are highly variable and should be determined empirically on a case-by-case basis during a pilot study.
4 Preparing for Stereology
The following two arrangements may be taken into consideration before starting a stereology analysis. First, remove the user bias by having the individual performing the analysis blinded to the samples and treatments represented on the slides. If the difference between the two groups appears to be large, different sampling parameters may be used for each group to increase efficiency. Furthermore, an independent second person should run the stereological analysis using identical procedures in order to reduce personal bias and increase validity. If inter-rater variability turns out to be high, further sampling is needed if the users are both properly trained. If inter-rater variability is low, this definitely lends confidence to the validity of the results.
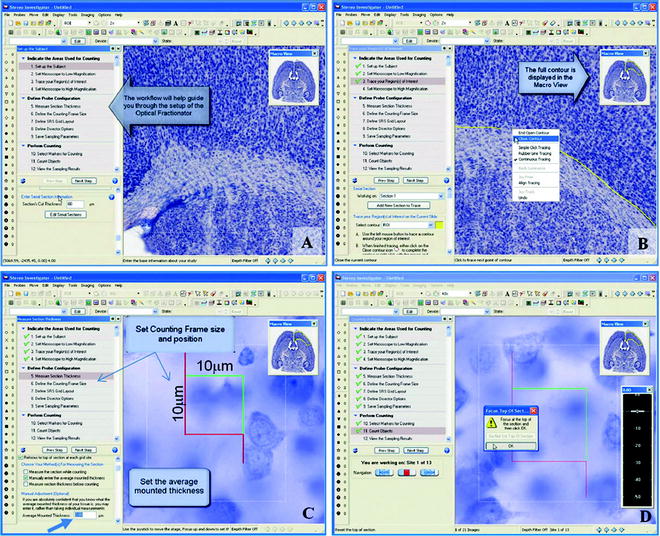
Performing many common stereology protocols, such as the Optical Fractionator, using immunostained or counterstained tissues, it is suggested that the user confirm the depth of penetration and measure the final mounted section thickness. While the final mounted and original section thickness are not required in Stereo Investigator, if the original cut thickness is supplied, the software can estimate the volume of the ROI as a bonus. A pilot test of 5–6 sections may be measured as described below. This can be easily accomplished within the Stereo Investigator software by following the Focus Position Meter. First, focus at the top of the section, where the cells first start to come into focus. Move down through the section following the Focus Position Meter to the point where the staining starts to fade or is less clear; if focusing down further does not bring more cells into focus, that point is the bottom of the section. The depth traversed provides information about the shrinkage of your tissue, a common occurrence for immunostained and counterstained tissue that is dehydrated through graded alcohol-xylene-based washes. Confirmation of depth of penetration and total section thickness is helpful prior to starting stereological counting. It may be advisable for new stereology users to learn how to measure the final mounted section thickness using differential interference contrast (DIC) microscopy or other means using brightfield microscopy. For stereological counting using brightfield, the user must use an objective lens with a sufficiently high numerical aperture (commonly 1.4 N.A.), achieve Kohler illumination, and then open the condenser aperture all the way, in order to get the thinnest possible depth of field. Without this step, the counting results will be far less robust than expected. Guard zones are established at the top and bottom of the section to allow for sampling in tissue where there are no “lost caps” or “craters” and also avoids sampling from an area where the tissue may have been badly deformed by the cutting process in a number of different ways. The guard zone is determined empirically for each study.
Equipment: The essential equipment required for a stereology system includes a microscope (e.g., a modern Leica, Zeiss, Nikon, or Olympus) with a motorized x-y-z stage interfaced with a dedicated cooled monochrome for fluorescent work and a color camera for brightfield work, and a microcator (Z focus position linear encoder) with the stage controller connected to a PC (Intel® Quad Core Xeon Processor W3540 2.93 GHz, 12 GB DDR3 SDRAM, 2 × 500 GB hard drives, 1 GB nVidia 9800 GT video card, DVD drive, USB and serial ports, Windows 7, 64-bit operating system). This configuration is based on the current hardware needed for Stereo Investigator. Other systems may have different hardware criteria. Whichever stereology software is used, the ability to generate a grid of sampling frames to overlay the microscopic images on the monitor for individual signal counting is required.
5 Using the Optical Fractionator in Stereo Investigator
Sequential procedures for counting using Stereo Investigator software (MBF Bioscience) and the Optical Fractionator probe are detailed below. Open the Stereo Investigator software and from the Probes menu choose the Optical Fractionator Workflow. In the next window, select Start a New Subject or Load subject from existing data file. At the bottom of the Set up the Subject panel (Fig. 4a), enter the fresh tissue cutting thickness. When starting the first section for a new subject, select a reference point. This may be any point in the section or within the region of your interest. The reference point should be easy to identify, allowing the software to perform parfocal and parcentric corrections when switching to high power. At low magnification (usually ×1 to ×10), trace the contour of the area you desire to sample. Anatomical or regional landmarks ensure the same area is traced and measured in each section. The actual cytoarchitectural ROI will be retraced on each subsequent section. On a two-button mouse, right clicking brings up a menu and you can select Close contour to end the tracing and close any gap between the beginning of the trace and the end (Fig. 4b). Switch to a high power (×40 or ×100, 1.4 N.A. oil objective) on the microscope. For brightfield work, it is critical to have the thinnest possible depth of field, requiring Kohler illumination and a fully open condenser aperture as well.
 < div class='tao-gold-member'>


Only gold members can continue reading. Log In or Register to continue
Stay updated, free articles. Join our Telegram channel
Full access? Get Clinical Tree
