general
CHAPTER CONTENTS
General1
1.1 Radiographic technique for the skeletal system1
1.2 Anatomy of bone: general principles2
1.3 Ossification and growth plate closures3
1.4 Response of bone to disease or injury3
1.5 Patterns of focal bone loss (osteolysis)4
1.6 Patterns of osteogenesis: periosteal reactions6
1.7 Principles of interpretation of skeletal radiographs7
1.8 Features of aggressive versus non-aggressive bone lesions8
1.9 Fractures: radiography, classification and assessment of healing9
Bones14
1.10 Altered shape of long bones14
1.11 Dwarfism15
1.12 Delayed ossification or growth plate closure15
1.13 Increased radiopacity within bone16
1.14 Periosteal reactions18
1.15 Bony masses19
1.16 Osteopenia21
1.17 Coarse trabecular pattern22
1.18 Osteolytic lesions22
1.19 Expansile osteolytic lesions24
1.20 Mixed osteolytic–osteogenic lesions25
1.21 Multifocal diseases28
1.22 Lesions affecting epiphyses29
1.23 Lesions affecting physes30
1.24 Lesions affecting metaphyses31
1.25 Lesions affecting diaphyses33
GENERAL
1.1. RADIOGRAPHIC TECHNIQUE FOR THE SKELETAL SYSTEM
The skeletal system lends itself well to radiography, but it must be remembered that only the mineralized components of bone are visible. The osteoid matrix of bone is of soft tissue radiopacity and cannot be assessed radiographically; this makes up 30–35% of adult bone. Articular cartilage is also of soft tissue opacity and is not seen on survey radiographs (see arthrography, 2.1). Lesions in the skeletal system may be radiographically subtle, and so attention to good radiographic technique is essential.
1. Highest definition film–screen combination consistent with the thickness of the area or appropriate digital radiography algorithm.
2. No grid is necessary except for the proximal limbs and spine in larger dogs; in smaller joints, insufficient scattered radiation is produced to warrant the use of a grid, and the presence of grid lines may obscure fine detail.
4. Close collimation to enhance radiographic definition by minimizing scatter, and for radiation safety.
5. Correct exposure factors to allow examination of soft tissues as well as bone.
6. Beware of hair coat debris creating artefactual shadows.
7. Radiograph the opposite limb for comparison if necessary.
8. Use wedge filtration techniques if a whole limb view is required (e.g. for angular limb deformity); use a special wedge filter or intravenous fluid bags.
9. Optimum viewing conditions – dry films, darkened room, bright light and dimmer facility, glare around periphery of film masked off.
10. Use a magnifying glass for fine detail; use bone specimens, a film library and radiographic atlases.
11. For analogue film, ensure good processing technique to optimize contrast and definition.
12. With digital radiography, manipulation of image size and greyscale is readily performed.
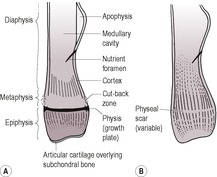
1.2. ANATOMY OF BONE: GENERAL PRINCIPLES (Fig. 1.1A and B)
Apophysis – Non-articular bony protuberance for attachment of tendons and ligaments; a separate centre of ossification.
 |
| Figure 1.1 |
Articular cartilage – Soft tissue opacity, therefore appears radiolucent compared with bones (unless mineralizing through disease). Provides longitudinal growth of epiphyses.
Cancellous bone – Spongy bone consisting of a meshwork of bony trabeculae; found in epiphyses, metaphyses and small bones. A coarse trabecular pattern is seen where forces are constant and a fine trabecular pattern where they are variable. The greater surface area compared with cortical bone results in a 40 times greater rate of remodelling in response to disease or injury. The cancellous bone of skull is called diploë.
Cortex – Compact lamellar bone formed by intramembranous ossification from periosteum. Uniformly radiopaque. Thickest where the circumference of the bone is smallest, where attached soft tissues exert stress or on the concave side of a curved bone and taper to nothing in the metaphyseal region.
Diaphysis – The shaft of a long bone; a tube of cortical bone surrounding medullary cavity and cancellous bone.
Endosteum – Similar to periosteum but thinner, and lines large medullary cavities; it may produce bone in some circumstances (e.g. fractures).
Epiphysis – The end of a long bone bearing the articular surface, which forms from a separate centre of ossification; cancellous bone with a denser subchondral layer.
Medullary cavity – Fatty bone marrow space in the mid-diaphysis; radiolucent and homogeneous.
Metaphysis – Between the physis and diaphysis; cancellous bone. In the young animal, it remodels bone from the growth plate into the diaphyseal cortex, hence its external surface may be irregular, especially in large dogs; this is known as the cut-back zone and should not be mistaken for a periosteal reaction or pathological osteolysis (Fig. 1.1A).
Nutrient foramen – Seen as a radiolucent line running obliquely through the cortex and carrying major blood vessels; its consistent location in long bones reflects relative growth in length from the two ends of the bone (it originates centrally in the fetus). Occasionally it may be in an aberrant location.
Periosteum – Fibroelastic connective tissue surrounding bone except at articular surfaces and where muscle fibres and tendons insert; its inner layer produces bone by intramembranous ossification causing increase in bone diameter.
Physis – Cartilaginous growth plate present in young animals and seen radiographically as a radiolucent band. Endochondral ossification at the physis results in increased length of the bone. Its width reduces with progressing ossification; after skeletal maturity, it may be seen as a sclerotic line or physeal scar. It provides longitudinal growth of metaphyses and diaphyses.
Sesamoids – Small bony structures lacking periosteum that form in tendons near joints; thought to reduce friction at sites of direction changes.
Subchondral bone – Thin, dense layer of bone beneath articular cartilage; appears more radiopaque than adjacent bone.
1.3. OSSIFICATION AND GROWTH PLATE CLOSURES
• This occurs in a preformed cartilage matrix for most of the skeleton by endochondral ossification; the skull forms within membranes by intramembranous ossification.
• At birth, ossification is seen radiographically only in diaphyses and skull bones; joints appear wide because epiphyses are still cartilaginous and therefore radiolucent.
• Subsequently, ossification centres appear in epiphyses, apophyses and small bones.
• These secondary ossification centres show ragged margination as ossification progresses.
• As skeletal maturity approaches, secondary ossification centres enlarge and become smoother in outline, and physes and the apparent joint spaces therefore become narrower.
• Some terminology: achondroplasia, absence of cartilage development; chondrodysplasia, disordered cartilage development; skeletal dysplasia, disordered skeletal development.
Growth plate closure times (dog)
Radiographic growth plate closure times are variable, and so a general range is given for each site. In an individual animal, closure times will normally be the same in right and left limbs (see Table 1.1).
| aIn the cat, growth plates fuse later, especially in neutered animals. | |
| Sources: Sumner-Smith, G. (1966) Observations on epiphyseal fusion of the canine appendicular skeleton. Journal of Small Animal Practice7, 303–312. Ticer, J.W. (1975) Radiographic Technique in Small Animal Practice. Philadelphia: Saunders. | |
| Growth Plate Closure Time | |
|---|---|
| Scapular tuberosity | 4–7 months |
| Proximal humerus | |
| Greater tubercle to humeral head | 4 months |
| Proximal epiphysis | 10–13 months |
| Distal humerus | |
| Medial to lateral condyle | 8–12 weeks |
| Medial epicondyle | 6 months |
| Condyle to diaphysis | 5–8 months |
| Proximal radius | 5–11 months |
| Distal radius | 6–12 months |
| Proximal ulna | |
| Olecranon | 5–10 months |
| Anconeal process | 3–5 months |
| Distal ulna | 6–12 months |
| Accessory carpal bone physis | 10 weeks–5 months |
| Proximal metacarpal I (dewclaw) | 6 months |
| Distal metacarpal II–V | 5–7 months |
| Phalanges (proximal P1, proximal P2 only) | 4–6 months |
| Pelvis | |
| Acetabulum | 4–6 months |
| Iliac crest | 1–2 years (or may remain open permanently) |
| Tuber ischii | 8–10 months |
| Proximal femur | |
| Femoral head | 6–11 months |
| Greater trochanter | 6–10 months |
| Lesser trochanter | 8–13 months |
| Distal femur | 6–11 months |
| Proximal tibia | |
| Medial to lateral condyle | 6 weeks |
| Tibial tuberosity to condyles | 6–8 months |
| Tuberosity and condyles to diaphysis | 6–12 months |
| Distal tibia | |
| Main physis | 5–11 months |
| Medial malleolus of distal tibia | 5 months |
| Proximal fibula | 6–12 months |
| Distal fibula | 5–12 months |
| Tuber calcis | 11 weeks–8 months |
| Vertebral endplates | 6–9 months |
1.4. RESPONSE OF BONE TO DISEASE OR INJURY
Regardless of cause, the pathology of bone response is essentially the same. There are only two mechanisms: bone loss (focal, osteolysis; diffuse, osteopenia) and bone production (osteogenesis). A combination of both processes may also occur. Bone is laid down and remodels according to Wolff’s law – bone is deposited at sites where it is required and resorbed where it is not; this also explains the orientation of trabeculae.
1. Bone loss (see 1.5 and 1.16)
• Recognized radiographically after approximately 7–10 days.
• Only the mineralized component of bone is visible radiographically, and 30–60% of mineral content must be lost before being detected radiographically.
• Radiography is therefore not a sensitive tool for detecting minor bone loss.
• Focal bone loss is easier to see than diffuse bone loss, by comparison with adjacent normal bone.
• Bone loss is easier to see in cortical bone than in cancellous bone, as cortical bone is more radiopaque.
• Osteopenia is a radiological term describing a generalized reduction in bone radiopacity. It is due to two different pathological processes:
– osteomalacia – insufficient or abnormal mineralization of organic osteoid
– osteoporosis – normal proportions of osteoid and mineral component, but reduced amounts.
2. Bone production (see 1.6)
• Sclerosis or osteosclerosis used as a radiological term describes increased bone radiopacity. It can be due to two different pathological processes:
– increased density of bone (e.g. sequestrum, subchondral compaction, enlargement of trabeculae)
– Superimposed periosteal or endosteal reaction.
• Apparent sclerosis may also be caused by superimposition of bones (e.g. overlapping fracture fragments).
• Sclerosis is also a pathological term meaning literally ‘hardening of tissue’ and refers to organs becoming hard and useless due to an excess of connective tissue; it is often applied to the central nervous system. Caution should therefore be exercised when using this word in a radiological sense in order that the meaning is clear.
3. Mixed reactions
• Many lesions combine osteolysis and new bone production to variable degrees.
• New bone may predominate and obscure underlying minor osteolysis.
• Conversely, superimposition of irregular new bone may create areas of relative radiolucency that mimic osteolysis.
• Consider also the possibility of two pathological processes being present simultaneously (e.g. synovial cell sarcoma in a joint with pre-existing osteoarthrosis).
1.5. PATTERNS OF FOCAL BONE LOSS (OSTEOLYSIS)
Bone loss may be recognized 7–10 days after an insult. It is easier to recognize in cortical than in trabecular bone and is more obvious if focal. Categorizing the type of osteolysis helps in differential diagnosis by suggesting the aggressiveness or activity of the disease process (see 1.8).
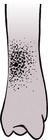
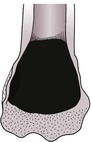
1. Geographic osteolysis (Fig. 1.2)
• A single large area or confluence of several smaller areas, usually more than 10 mm in diameter.
• Clearly marginated, i.e. there is a narrow zone of transition to normal bone.
• Usually affects both the medullary cavity and the cortex.
• The overlying cortex may be thinned and displaced outwards due to a lesion that is expansile (see 1.19 and Figs 1.25 and 1.26).
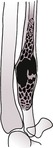
• Usually due to a benign or non-aggressive, low-grade lesion such as a bone cyst, pressure atrophy or a benign dental tumour.
 |
| Figure 1.2 |
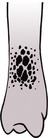
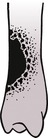
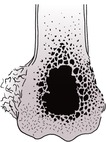
2. Moth-eaten osteolysis (Fig. 1.3)
• Multiple areas of osteolysis, often varying in size and usually 3–10 mm in diameter.
• May coalesce to form geographic osteolysis in the centre of the lesion.
• Less well defined, with a wider zone of transition to normal bone.
• The cortex is often irregularly eroded.
• Due to a more aggressive disease process such as a malignant tumour or osteomyelitis.
 |
| Figure 1.3 |
3. Permeative osteolysis (Fig. 1.4)
• Numerous small pinpoint areas of osteolysis, 1–2 mm in diameter.
• Poorly defined, with a wide zone of transition to normal bone – areas of osteolysis are more spread out at the periphery.
• Mainly recognized in the cortex (hard to see in the medulla because of its trabecular pattern).
• The cortex is irregularly eroded from the endosteal side.
• Due to a highly aggressive disease process such as a very active malignant tumour or fulminant (often fungal) osteomyelitis.
 |
| Figure 1.4 |
4. Mixed pattern of osteolysis (Fig. 1.5)
Often more than one type of osteolysis is recognized (e.g. central geographic osteolysis surrounded by moth-eaten and permeative zones); the nature of the lesion is denoted by the most aggressive type of osteolysis present.
 |
| Figure 1.5 |
5. Osteopenia (diffuse reduction in bone radiopacity – see also 1.16)
• Differential diagnoses are overexposure, overdevelopment, other causes of fogging.
• Reduced radiopacity of bone compared with soft tissues (ghostly bones).
• Thin, shell-like cortices.
• Coarse trabecular pattern, as smaller trabeculae are resorbed.
• Apparent sclerosis of subchondral bone, especially in vertebral endplates, as these are relatively spared and therefore show high contrast with the osteopenic bone.
• Double cortical line due to intracortical bone resorption is occasionally seen.
• If in a limb due to disuse, the epiphyses and small bones are affected predominantly.
• Pathological folding fractures may occur, seen as sclerotic lines.
1.6. PATTERNS OF OSTEOGENESIS: PERIOSTEAL REACTIONS
Periosteal new bone is also usually recognized 7–10 days after an insult (earlier in young animals). Identifying its nature helps in differential diagnosis by suggesting the aggressiveness of the disease process (see 1.8).
There are two main groups of periosteal reactions: continuous and interrupted (Figs 1.6 and 1.7). However, these represent arbitrary division of a spectrum of periosteal reactions.
 |
| Figure 1.6 |
 |
| Figure 1.7 |
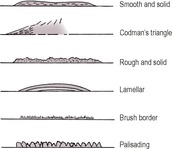
1. Continuous periosteal reactions
Often slow disease processes that allow new bone to form in an orderly fashion. Usually represent a benign or healed process but may also be seen early in a more aggressive disease or at the edge of an overtly aggressive lesion. Described below in order of increasing aggressiveness.
• Smooth and solid (e.g. chronic mild trauma, remodelled more active new bone, panosteitis, healed subperiosteal haematoma).
• Codman’s triangle – solid triangle of new bone at the edge of a more active lesion, due to bony infilling beneath advancing periosteal elevation. Often at the diaphyseal edge of a primary malignant bone tumour.
• Rough and solid (e.g. trauma, adjacent soft tissue inflammation). May settle to become smooth.
• Lamellar – periosteum elevated by exudate or haemorrhage and produces a single line of new bone parallel to the cortex that fills in with time, becoming solid, for example early metaphyseal osteopathy (hypertrophic osteodystrophy).
• Lamellated (‘onion skin’) – late stage, after recurrent episodes of periosteal elevation due to sequential insults creating several layers of new bone, for example late metaphyseal osteopathy (hypertrophic osteodystrophy), fungal osteomyelitis.
• Palisading (thick brush-like) – solid chunks of new bone perpendicular to the cortex (e.g. hypertrophic osteopathy, craniomandibular osteopathy).
• Brush border (thin brush-like, ‘hair on end’) – periosteum lifted fairly rapidly over an extensive area of cortex with new bone laid down along the perpendicularly oriented Sharpey’s fibres (e.g. adjacent soft tissue inflammation, acute osteomyelitis, early neoplasia).
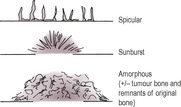
2. Interrupted periosteal reactions
Rapidly changing lesions breaching the cortex and periosteum with no time for orderly repair. Variable in radiopacity and depth and may be in short, disconnected segments. Often associated with underlying cortical lysis.
• Spicular – wisps of new bone extending out into soft tissue, roughly perpendicular to the cortex.
• Sunburst – radiating spicular pattern, deepest centrally; indicates a focal lesion erupting through the cortex and extending into soft tissues.
• Amorphous – not a periosteal reaction as such, but fragments of new bone that are variable in size, shape and orientation; often cannot be differentiated from remnants of displaced original bone and tumour bone produced by osteosarcomas.
1.7. PRINCIPLES OF INTERPRETATION OF SKELETAL RADIOGRAPHS
Bone has a limited response to disease or insult, and so lesions with different aetiologies may look similar radiographically, for example neoplasia and osteomyelitis. A definitive diagnosis may not be possible without further tests or biopsy. The radiologist must examine radiographs methodically, identify changes, recognize patterns and then formulate lists of differential diagnoses. Patient type, history, clinical signs, blood parameters, geographic location (current or previous), change of the lesion with time and response to treatment must be considered. Radiographs should be oriented consistently on the viewer to promote familiarity with the normal appearance, and bone specimens and radiographic atlases used for reference.
A useful mnemonic for differential diagnosis of aetiology is VITAMIN D:
V vascular
I inflammatory or infectious
T trauma
A anomalous
M metabolic
I idiopathic
N neoplastic
D degenerative
Features to consider when interpreting skeletal radiographs include the following:
1. Distribution of lesions.
a. Generalized or diffuse changes.
– Metabolic or nutritional disease.
– Neoplasia (e.g. widespread osteolysis – multiple myeloma; widespread sclerosis – lymphoma).
b. Whole limb.
– Disuse.
c. Focal lesions.
– Congenital or developmental.
– Trauma.
– Infection or inflammation.
– Neoplasia.
d. Symmetrical lesions.
– Metabolic disease.
– Haematogenous osteomyelitis.
– Metaphyseal osteopathy (hypertrophic osteodystrophy).
– Hypertrophic osteopathy.
– Bilateral trauma.
– Metastatic tumours.
2. Number of lesions.
a. Monostotic.
– Congenital or developmental.
– Trauma.
– Localized infection (trauma, iatrogenic).
– Neoplasia (primary bone tumour, soft tissue tumour distant from joint, solitary metastasis).
b. Polyostotic (see 1.21).
3. Location of lesions (see 1.22, 1.23, 1.24 and 1.25).
a. Epiphysis (e.g. various arthritides, chondrodysplasias, osteochondrosis, soft tissue tumours affecting joints).
b. Physis – mainly young animals (e.g. haematogenous osteomyelitis, trauma, premature closures, rickets).
c. Metaphysis, e.g. haematogenous osteomyelitis, metaphyseal osteopathy (hypertrophic osteodystrophy), primary malignant bone tumours.
d. diaphysis (e.g. trauma, panosteitis, hypertrophic osteopathy, metastatic tumours).
5. Presence and type of osteogenesis (see 1.6 and Figs 1.6 and 1.7).
a. Periosteal.
b. Endosteal.
c. Trabecular.
d. Neoplastic – in bone-producing tumours.
e. Heterotopic – ossification in an abnormal location.
f. Dystrophic – ossification in previously damaged soft tissue.
6. Zone of transition between lesion and normal bone.
a. Short – well-demarcated lesion, abrupt transition to normal bone; usually benign or non-aggressive disease.
b. Long – poorly demarcated lesions, gradual transition to normal bone; usually aggressive disease.
7. Soft tissue changes.
a. Muscle atrophy.
b. Soft tissue swelling.
c. Joint effusions.
d. Displacement or obliteration of fascial planes or fat pads.
e. Soft tissue emphysema.
f. Soft tissue mineralization.
g. Radiopaque foreign bodies.
h. Abnormalities in other body systems (e.g. lung metastases).
8. Rate of change on sequential radiographs and presence of response to treatment. The time interval between radiographic studies is arbitrary and determined by the apparent activity or aggression of the lesion and the age of the animal – active lesions may change within a few days, and both bone loss and new bone production occur more rapidly in young animals.
1.8. FEATURES OF AGGRESSIVE VERSUS NON-AGGRESSIVE BONE LESIONS
An aggressive lesion is one that extends rapidly into adjacent normal bone with no or minimal visible host response attempting to confine the lesion (Table 1.2 and Figs 1.8 and 1.9). Assessment of this activity is essential in order to compile a realistic list of differential diagnoses. Lesions may change their status with time or in response to treatment. Intermediate grades of aggression exist through a spectrum (e.g. chronic osteomyelitis, low-grade malignancy).
| aIf mixed signs are present, the lesion should be categorized according to its most aggressive feature. | |
| Non-Aggressive | Aggressive |
|---|---|
| For example uncomplicated trauma, degenerative or resolving lesion, benign neoplasia, bone cyst | For example malignant neoplasia, fulminant osteomyelitis |
| Well demarcated | Poorly demarcated |
| Narrow, distinct zone of transition | Wide, indistinct zone of transition |
| Absent or geographic osteolysis | Permeative osteolysis |
| Cortex may be displaced and thinned but rarely broken | Cortex interrupted |
| Continuous solid or smooth periosteal reaction | Interrupted, irregular periosteal reaction |
| ± surrounding sclerosis | No surrounding sclerosis |
| Static or slow rate of change | Rapid rate of change |
1.9. FRACTURES: RADIOGRAPHY, CLASSIFICATION AND ASSESSMENT OF HEALING
Causes of fractures
2. Pathological; spontaneous or following minor trauma to weakened bone.
a. Neoplasia.
b. Bone cyst.
c. Osteomyelitis.
d. Diffuse osteopenia such as nutritional secondary hyperparathyroidism (usually folding fractures).
g. Empty screw hole.
3. Stress protection – weakened bone at the end of an orthopaedic plate.
4. Fatigue fracture – due to repeated stress on a bone, especially metacarpals and metatarsals in racing greyhounds.
5. Defect in bone due to biopsy or surgery, or after plate removal.
Radiography
• Obtain at least two radiographs, including views at 90° to one another (orthogonal views).
• Include joints above and below to check for joint involvement and rotation of fragments.
• In young animals, examine growth plates for signs of injury; after trauma to the antebrachium, re-radiograph after 3 weeks to check for signs of premature closure of the distal ulnar physis.
• Radiograph the opposite leg for assessment of true bone length if surgery is planned.
• Use a horizontal beam if necessary (e.g. if pain, spinal instability or thoracic trauma prevent dorsal recumbency).
• Increase exposure factors if soft tissue swelling is present.
• Thoracic and abdominal studies are often required in cases of road accident or falls from high buildings (e.g. to detect pulmonary contusion, ruptured diaphragm, pneumothorax or bladder rupture).
• If hairline fractures are suspected but not seen, repeat the radiographs 7–10 days later (or use scintigraphy).
• Remember that radiographs give no information about damage to articular cartilage or surrounding soft tissues.
Radiographic signs of fractures
1. Disruption of the normal shape of bone or of the cortex or trabecular pattern.
2. Radiolucent fracture lines can be mimicked by:
a. nutrient foramen
b. overlying fascial plane fat
c. skin defect or gas in fascial planes – open fracture
d. normal growth plate or skull suture
e. Mach line – dark lines along edge of two overlapping bones due to an optical illusion
f. grid line artefact from damaged grid.
NB: hairline or minimally displaced fractures radiating along the shaft from the main fracture site may be seen only if parallel to X-ray beam; this may require additional views.
3. Increased radiopacity of cortex and medulla if the fracture is folding or impacted or if fragments override.
5. Ballistics, foreign material and gas – compound fractures.
6. Evidence of fracture healing – see below.
7. Muscle atrophy and disuse osteopenia.
Reasons for overlooking fractures include incorrect exposure or processing, non-displacement of fracture fragments, insufficient number of views, confusion with growth plates and fracture reduced by positioning.
Classification of fractures
1. Closed, or open or compound (therefore risk of infection, especially if the skin has broken outside to inside).
2. Simple (single fracture), comminuted (three or more fragments), multiple (fracture lines do not connect; same bone or different bones) or segmental (two or more separate fracture lines in a single bone).
3. Transverse, oblique, spiral, longitudinal or irregular.
4. Complete (entire bone width) or incomplete (one cortex only).
a. Greenstick fracture – convex side cortex; alternatively defined as a fracture with minimal separation between fragment ends and periosteum remains intact.
b. Torus fracture – concave side fracture.
5. Chip fracture (no or one articular surface involved) or slab fracture (two articular surfaces involved).
6. Articular – within the limits of the joint capsule, whether or not the fracture line crosses the articular surface. Young animals are over-represented due to the presence of relatively weak growth plates. Alternatively, non-articular.
7. Avulsion (traction by soft tissue attachment) – usually at an apophysis.
8. Fatigue or stress fracture – one cortex only, from repeated minor trauma.
9. Impaction or compression fracture – shortening of bone due to stress along its length, or one fragment driven into another; especially vertebrae.
10. Fracture (sub)luxation – fracture with associated soft tissue injury causing joint instability or displacement.
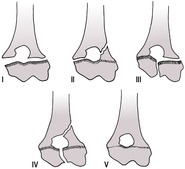
11. Salter–Harris fractures (Fig. 1.10) – fractures involving unfused growth plates; may lead to growth disturbances (e.g. shortening or angulation of bone). They can occur surprisingly late in neutered cats, as the growth plates remain open longer than in entire animals.
Assessment of fracture: at the time of injury
1. Location – which bone, which anatomical area of the bone?
2. Age of fracture (if not known) – assess sharpness of fracture margins and look for evidence of healing.
3. Type of fracture – see above.
5. Underlying bone radiolucency or loss of normal architecture, for evidence of pathological fracture (Fig. 1.11).
6. Involvement of joints – subsequent osteoarthritis may occur.
7. Presence of foreign material.
8. Soft tissue changes.
9. Injuries elsewhere in body (e.g. with pelvic trauma, check for bladder or urethral rupture; thoracic pathology).
Assessment of fracture: immediate post-operative radiographs
1. Degree of reduction – at least 50% bone contact on orthogonal views is needed for healing.
2. Alignment.
a. Medial–lateral and cranial–caudal.
b. Rotational alignment – include joints above and below.
3. Adequacy of implant type, size and placement.
4. Joints – congruency, lack of entry by implants.
5. Presence of cancellous bone grafts.
6. Soft tissues.
(Useful mnemonic: ABCDS – alignment, bone, cartilage, device, soft tissues; alternatively, consider the four A’s – apposition, alignment, angulation, apparatus).
Fracture healing
NB: need two orthogonal views to assess healing, as the fracture may appear bridged on one view and not on another. Healing occurs more rapidly in young animals.
1. Primary bone healing – direct bridging of the fracture by osseous tissue, re-establishing cortex and medulla without intermediate callus. Occurs with a high degree of reduction and stabilization of the fracture site. Stages 1, 2 and 5 (Fig. 1.12).
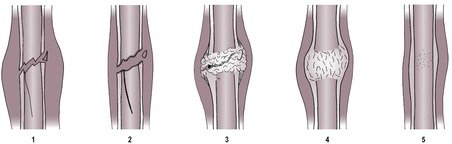
2. Secondary bone healing – unstructured bone laid down in soft tissue as a callus and subsequently remodelled. Stages 1–5 (Fig. 1.12).
• Stage 2 (approximately 1–2 weeks): reducing soft tissue swelling; fracture line blurred due to hyperaemia and bone resorption; hairline fractures widened and more obvious; early, indistinct periosteal reaction, especially in young animals.
• Stage 3 (approximately 2–3 weeks): abundant, unstructured bony callus forming (size depends on the type of fracture, location, use of limb, stability at site, vascularization); partial bridging of fracture line; structurally strong.
• Stage 4 (approximately 3–8 weeks): continued filling in of the fracture line; early remodelling of the callus.
• Stage 5 (approximately 8 weeks on): continued remodelling and reduction in size of callus; restoration of cortices and trabecular pattern; the limb may straighten slightly if malunion occurred originally.
Assessment of fracture: subsequent examinations
1. The intervals at which follow-up radiographs are obtained depend on the age of the patient, the severity of the injury, the nature of the repair and the condition of the patient. Usually 2- to 3-week intervals for young animals and 4–6 weeks for mature animals are adequate.
2. Use the same radiographic technique as for the original radiographs, for comparison (may need to reduce exposure factors if soft tissue is less due to reduction of swelling or muscle atrophy).
3. Alignment of fragments.
4. Position and integrity of implants – migration, bending, cracking or fracture of implants may occur.
5. Stability of fracture site – evidence of instability following surgical repair includes migration of implants, radiolucent haloes around screws and pins (differential diagnoses are infection, bone necrosis from high-speed drill, artefactual radiolucent halo around metallic implants in some digital images).
6. Stage of fracture healing.
7. Amount of callus, for example active fractures may be hypertrophic (moderate to large amount of callus) or oligotrophic (little callus), whereas inactive fractures show no callus or atrophy of bone ends.
8. Evidence of infection – osteolysis especially around implants, unexpected periosteal reactions (differential diagnosis is periosteal stripping), sequestrum formation, soft tissue swelling ± emphysema.
9. Evidence of secondary joint disease.
10. Evidence of disuse – muscle atrophy, osteopenia.
11. The six A’s – apposition, alignment, angulation, apparatus, activity of bone healing and architecture of bone and surrounding soft tissue.
Complications of fracture healing
1. Delayed union – longer than expected time to heal for the type and location of fracture, but evidence of bone activity is present.
a. Disuse.
b. Instability.
c. Poor reduction.
d. Poor nutrition.
e. Old age.
f. Infection.
g. Poor vascularity.
h. Large intramedullary pin.
i. Presence of a sequestrum.
j. Undetected underlying pathology (e.g. neoplasia).
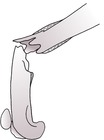
2. Non-union – fracture healing has apparently ceased without uniting the fragments, usually 10–12 weeks post fracture; bone ends smooth with sealed medullary cavity. Predisposed to by movement or infection at the fracture site.
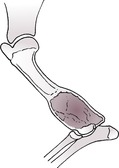
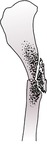
a. Non-viable or biologically inactive, for example atrophic (dying back) (Fig. 1.13) – no callus, pointed bone ends; especially the radius and ulna in toy breeds of dog that have been treated with external co-optation or intramedullary pinning; also dystrophic or necrotic non-union (devitalized intermediate fragment), defect non-union (significant bone defect).
 |
| Figure 1.13 |
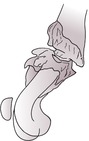
b. Viable or biologically active, for example hypertrophic (‘elephant’s foot’) (Fig. 1.14) – new bone surrounds bone ends but does not cross the fracture line, giving a bell-shaped appearance; fragment ends parallel; medullary cavity may appear sealed; also lesser degrees of callus or absent callus (oligotrophic).
 |
| Figure 1.14 |
Both types may form a false joint in which the fragment ends are contoured (e.g. one is concave and the other is convex or pointed).
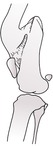
3. Malunion (Fig. 1.15) – bones fuse but with incorrect alignment. Subsequent remodelling may correct the malunion to some extent. Joints proximal and distal to the site may become arthritic due to altered stresses.
 |
| Figure 1.15 |
4. Excessive callus formation.
a. Movement at fracture site.
b. Infection.
c. Periosteal stripping.
d. Incorporation of bone grafts.
5. Ossification of stripped periosteum, especially in young animals (e.g. rhino horn or bucket handle callus often seen on caudal aspect of femur); not usually a clinical problem.
6. Osteomyelitis – leads to delayed or non-union; differential diagnosis is exuberant callus due to instability at the fracture site.
7. Sequestrum formation – a devitalized piece of bone that will impede healing and/or lead to sinus formation. Seen radiographically as a sharply defined fragment of dense bone with a surrounding radiolucent space containing pus. May be surrounded by a sclerotic involucrum attempting to wall off the process.
8. Fracture disease – a clinical syndrome with joint stiffness and muscle wastage due to disease; radiographs show osteopenia.
9. Neoplastic transformation – may be years later, especially if metallic implants are present or healing was complex. The mechanism is not known but is possibly due to chronic inflammation. Usually in fractures sustained at 1–3 years of age.
10. Metallosis – a sterile, chronic, proliferative osteomyelitis that may result from reaction to metallic implants, especially if dissimilar metals have been combined; less common in domestic animals than in humans due to their shorter lifespan.
Ultrasonographic assessment of fracture healing
Ultrasonography can be used to assess soft tissues and bony surfaces of fractures and calluses, both at the time of injury and during the healing process. Ultrasonography permits detection of healing earlier than with radiography and therefore can prevent unnecessarily long limb immobilization. Vascularity of tissues can be assessed with power Doppler.
Stay updated, free articles. Join our Telegram channel

Full access? Get Clinical Tree


