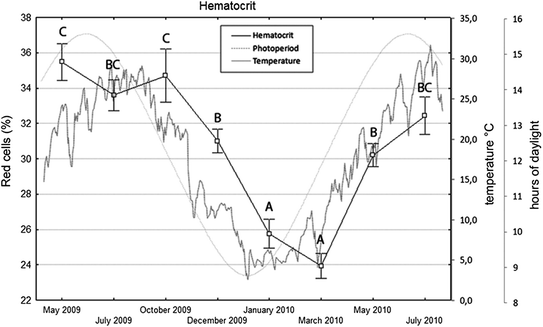
Fig. 1.1
Variations in serum cortisol of sea bass over a 14-month period (mean ± SE). Different letters indicate significant differences (p < 0.05)
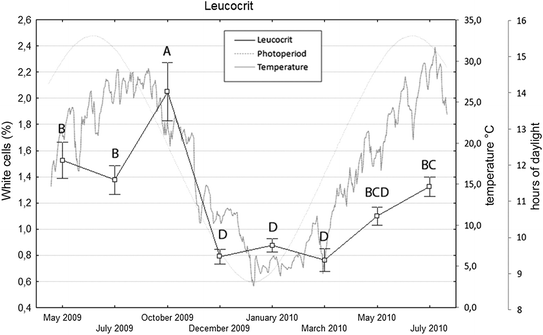
The hematocrit was significantly lower in January and March 2010 than the other samples (p < 0.05; Fig. 1.2). The leucocrit was significantly lower in December 2009, January 2010, and March 2010 compared to the other months (p < 0.05; Fig. 1.3). The highest value was recorded in October (p < 0.01).


Fig. 1.2
Variations in hematocrit of sea bass over a 14-month period (mean ± SE). Different letters indicate significant differences (p < 0.05)

Fig. 1.3
Variations in leucocrit of sea bass over a 14-month period (mean ± SE). Different letters indicate significant differences (p < 0.05)
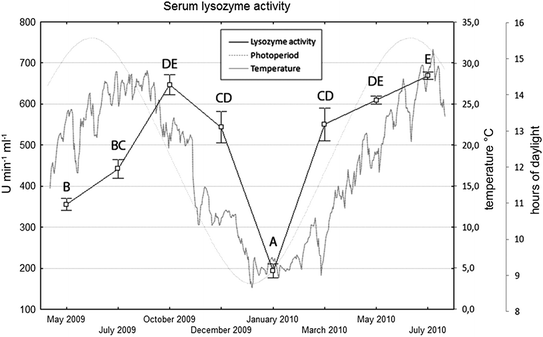
Serum lysozyme activity increased from May to October 2009, then decreased until January 2010 and increased again after that point (Fig. 1.4). The lowest values were recorded in January (p < 0.01). Higher values were found in July 2010 than in May, July, and December 2009 and March 2010, but these were not significantly different from those in October 2009 and May 2010.


Fig. 1.4
Variations in serum lysozyme activity of sea bass over a 14-month period (mean ± SE). Different letters indicate significant differences (p < 0.05)
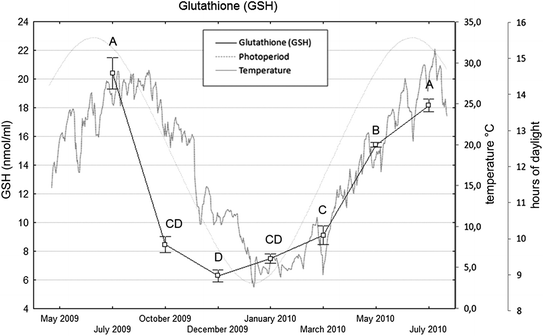
The GSH decreased from July to December 2009 and then increased until July 2010 (Fig. 1.5). The lowest values were found in October and December 2009 and January and March 2010, and the highest were in July 2010 (p < 0.05).


Fig. 1.5


Variations in glutathione (GSH) of sea bass over a 12-month period (mean ± SE). Evaluation of GSH in May 2009 was not possible because of a lack of serum. Different letters indicate significant differences (p < 0.05)
Stay updated, free articles. Join our Telegram channel

Full access? Get Clinical Tree


