Fig. 1.
(a) Individual SmartCage with a mouse in a normal home cage. The floor-sensor was placed in the home cage floor and IR array was mounted inside the platform. The floor vibration sensor amplifier, IR processor, and a microcontrol unit were assembled at the front print circuit board. (b) A single USB cable links directly or via a hub to the host PC for simultaneous operation of 1–8 SmartCages and provides power supply. Signals were transmitted via the USB cable to the PC. Two PCs (one laptop and one desktop) operated 16 SmartCages simultaneously, and recording ran from seconds to days under light/dark cycle.

Fig. 2.
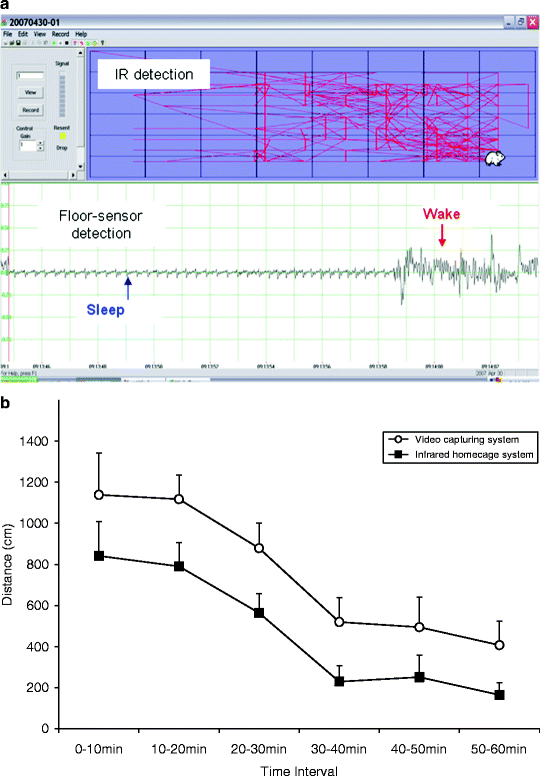
(a) Screenshot of real-time detection of mouse position—movement detected by IR matrix and sleep/wake was detected by the floor sensor. The upper panel consists of IR detection traces and the bottom traces are simultaneously recorded floor-sensor signals. (b) Comparison of activity measurements using IR matrix in SmartCage and the video tracking system. The animals were initially more active when placed in a fresh home cage and then gradually settled down. SmartCage IR detection and the video tracking showed identical patterns. However, the absolute value of the IR is approximately 10% less compared to video tracking system. This could be resulted from lower resolution in the IR system or calculation methods differences.
2 Materials
2.1 Test Subjects
Mouse or rat test subjects of appropriate strain, sex, and age according to the experimental designs can be purchased from a number of vendors.
2.2 Apparatuses and Devices
A variety of photo-beam (also called IR photocell)-based behavioral apparatuses of similar design are commercially available from a number of manufactures, for example, AfaSci (www.afasci.com), Columbus Instruments (www.colinst.com), Coulbourn Instruments (www.coulbourn.com), Lafayette Instrument (www.lafayetteinstrument.com), MED Associates (www.med-associates.com), Omnitech Electronic (www.omnitech.ca), San Diego Instruments (www.sandiegoinstruments.com), Stoelting Co (www.StoeltingCo.com), TSE Systems (www.TSESystems.com), etc.
Force Plate Actimeter was produced by Basinc (www.basinc.com). Laboratory Animal Behavior Observation, Registration and Analysis System (LABORAS™) was made by Metris (www.metris.nl.com).
Video (CCD) camera with image-tracking technology can be purchased from Noldus (www.noldus.com) and Clever Sys (www.cleversysinc.com).
3 Methods
The authors have been directly involved in the development of the integrated SmartCage™ system and extensively employed them in our preclinical research, thus we will use this system as an example to illustrate how to effectively study spontaneous activity in the animal home cage. The principles and practical notes described here are applicable to the use of other similar systems.
3.1 Set-Up of the SmartCage™ Monitoring System
The SmartCage™ through a USB cable communicates with the host computer (PC) that operates the system and its data acquisition. The mouse cage is placed into the SmartCage™ platform (Fig. 1a). Most apparatuses are usually designed with a little more room for tolerance of slightly different-sized home cages made by different manufacturers. Therefore, it is imperative that the rodent cage is located in the center of SmartCage platform, since placing it too far left or right may affect position detection. Finally, a USB cable plug connects to a corresponding port on the SmartCage™ board 1 (front, Fig. 1a) and the recording can be started. One PC with a hub can operate eight SmartCages™ simultaneously (Fig. 1b).
3.2 Home Versus Fresh Cage
The SmartCage™ system and some other photocell-based systems can be set up at the animal facility so that environmental effects (e.g., light intensity and cycle, background sound and scent) will be eliminated compared to setting them up in separate behavioral testing rooms. Because all measurements will be made in the animal’s home cage, transportation-induced stress will be minimized, thereby improving data reliability and assay reproducibility. Prepare the test subject in the home cage for at least 1 h prior to placing it into the monitoring system. This will minimize the habituation time to the apparatus and the test subject will be ready to be manipulated, for example treated with a drug.
On the other hand, if the experiment design is to study the subject in response to a relatively novel arena, or to test for light/dark preference (see below for details), then the subject should be transferred into a fresh home cage and recording should start immediately. Data (activity counts, locomotion, rearing, and rotations) can be simultaneously recorded for the first 10 min following introduction of the mouse to a freshly changed “novel” cage. It usually takes about 1 h for the mouse to habituate to the fresh cage. The difference in habituation per se could be meaningful in assessment of certain behavioral phenotypes.
3.3 Key Parameters and Interpretation
Activity measurements: Active wakefulness is defined as actively moving, rearing, and exploratory behaviors. Home cage activity variables include activity counts, i.e., the photocell beam breaks, locomotion (distance traveled and speed), and rearing counts. Activity counts are obtained from the lower horizontal IR sensors (along the x and y axis). Likewise, distance traveled in centimeters is obtained from the lower horizontal IR, and calculated taking into account the animal’s moving path. Locomotion is defined as the moving distance longer than the whole length of the test animal. The calculated traveling distance (at any given time period, called “block,” (i.e., “time bin”) or “total measuring period”), and speed are two main parameters for locomotor activity (Fig. 2b). The z-axis photocell beam break counts reflect the number of beam interruptions in the upper row of IR sensors and indicate rearing or climbing activity, which is thought to be part of exploratory behavior parameters. All IR data (beam break activity counts, locomotion, rearing, and rotations) are continuously recorded at a 4-Hz sampling rate. Absolute and percent time in a chosen block spent in this arousal state are also reported. Mice are most active within the first 1 h when transferred to a fresh or new cage, and then their activity levels gradually decrease. After their activity is stable, treatment with the test drug can be started.
Our first step in verification of the SmartCage™ system was examination of the accuracy of automatic data analysis by verification with visual inspection and conventional techniques. The IR activity and locomotion measures in the SmartCage™ were compared with the video tracking system. The individual mouse was placed into a freshly prepared home cage and recorded simultaneously using the SmartCage™ system and a video camera placed above the SmartCage™ system. The accumulated traveling distance at a given time block was automatically calculated by the CageScore™ program (Program associated with the SmartCage™ system; AfaSci, Inc.). The video images were processed using the video tracking of rodent activity software (SMART Video Tracking System, San Diego Instruments). The analyzed data obtained from the two systems indicated that the pattern in activity levels were identical, though the absolute value is slightly different when comparing the SmartCage™ to the video system (Fig. 2b). This initial validation indicated that that the activity levels recorded by the SmartCage™ system can adequately identify changes in activity patterns.
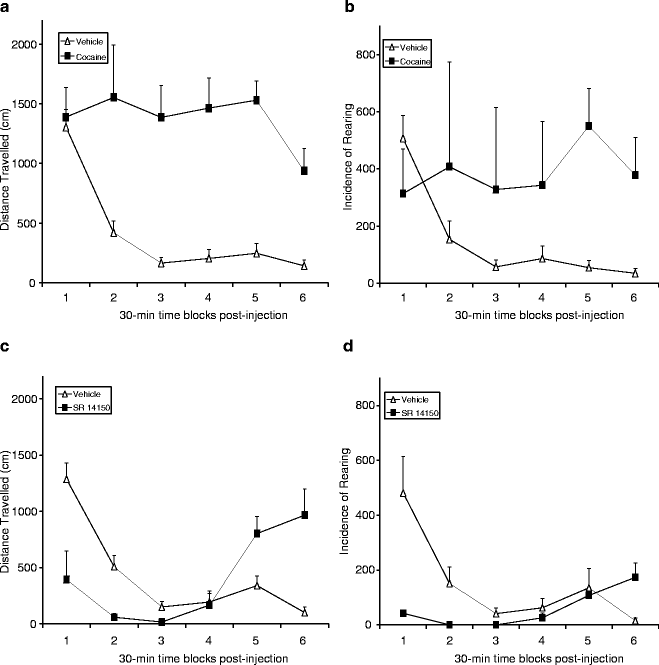
To further validate the IR detection, we used well-established drugs that are known to increase or decrease animal activity. Mice on day 1 received an injection of vehicle and on day 2 received an injection of the stimulant cocaine (30 mg/kg, i.p.). Immediately following the injection, individual animals in their home cage, complete with food and water in the top metal rack, were placed into the SmartCage™ system. The mice were continuously monitored for 24 h following the injection. It is clearly evident via SmartCage™ assessment that cocaine increases distance traveled and rearing activity following drug administration, lasting for approximately 3 h. In contrast, vehicle injection mice gradually decreased their activity to a basal level within half an hour (Fig. 3a). Conversely, drugs that produce sedation effects decreased the spontaneous activity measured by the SmartCage™. The nociceptin/orphanin FQ (N/OFQ) peptide acting on its receptor (NOP) causes sedation, anxiolytic effect, and modulates nociception (22, 23). These latter experiments were conducted with SR14150 (29). SR14150 is an NOP receptor agonist that is analgesic and produces reduced levels of activity relative to controls when placed into an experimental setting (23). The same procedure as described with cocaine was used whereby animals received an injection of vehicle on the first day and an injection of the SR 14150 (10 mg/kg, i.p.) on the second day. SR 14150 produced an initial decrease in activity (e.g., distance traveled and rearing) followed by a “rebound” and increase in activity (Fig. 3b).


Fig. 3.
(a) Cocaine (30 mg/kg, i.p.) increases distance traveled (cm) and rearing activity compared to vehicle baseline in 24-h recordings (n = 8 each group). (b) The nociceptin/orphanin FQ (N/OFQ) receptor (NOP), agonist SR 14150 initially decreases distance traveled (cm) and rearing activity and later “rebound” hyperactivity (n = 4 each group) comparing to vehicle baseline. Data were displayed between the injection time and 3 h following the injection for clarity.
Animal moving paths and rotations: Movement pattern and regional distribution can also be tracked by IR detection with the SmartCage™ system. Travel in different zones (the analysis program can divide the home cage floor between 2 and 12 zones), the times spent in different zones, and the distance traveled in each zone are automatically calculated and used as indicators to assess the structure of locomotor activity. In wakeful state, the locomotor activity of mice presented obvious regional and temporal properties. Mice preferred to stay in zones where food and water are provided, and frequently visit the peripheral zones in a cycling manner, but seldom the center zones within a 24-h period.
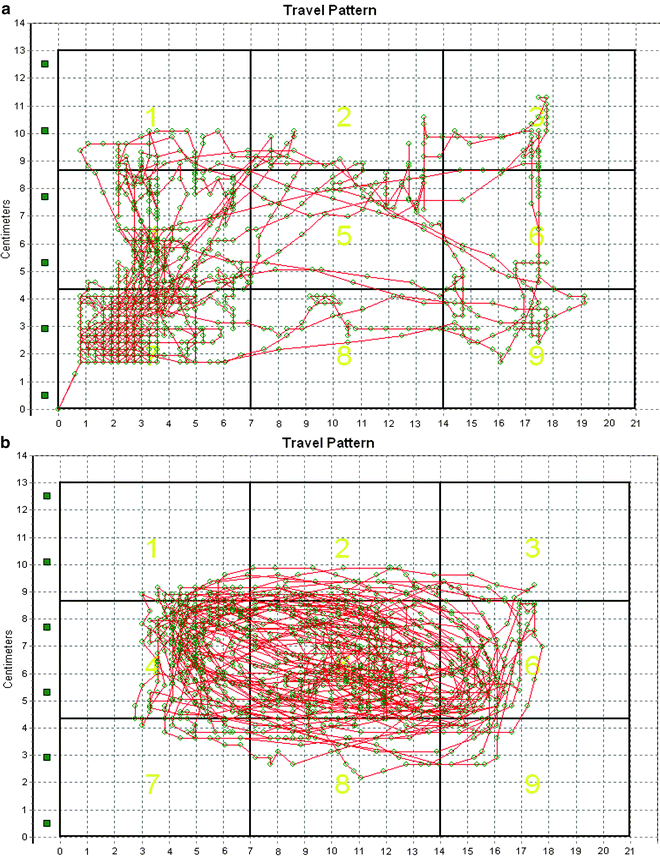
One cycling or rotation of the mouse’s movement can also be calculated using a three-point egocentric method of reference along the x- and y-axis and achieved by the accumulated 360° turn. Circling behavior starting from the mouse’s right side (i.e., clockwise) is designated as (+) positive direction, while left turning, is anticlockwise cycling and is designated (−) negative direction. The net rotation is the summation of the left and right circling with (−) and (+) indicating predominant left and right rotation, respectively in the chosen time block. In normal animals the net rotation is close to zero. In animals treated with the NMDA antagonist MK-801 there is a clear difference in the movement patterns when compared to vehicle controls (Fig. 4). This difference in circling pattern is also evident in certain disease models. For example, in the mouse stroke model of middle cerebral artery (MCA) occlusion the animal predominantly cycled in one direction depending on which side of the MCA was occluded. As a note, the SmartCage™ system can only record an animal making large cycles but not turning in the same place due to the limitations of spatial resolution (data not shown).


Fig. 4.
Movement pattern and zone distribution from a representative mouse in control (saline injection (a)) and 30 min after the injection of the NMDA antagonist MK-801 (1 mg/kg, i.p. (b)). Note MK-801 caused excessive anticlockwise rotation or cycling at the central zone, in addition to causing hyperactivity.
< div class='tao-gold-member'>
Only gold members can continue reading. Log In or Register to continue
Stay updated, free articles. Join our Telegram channel

Full access? Get Clinical Tree


