Fig. 1.
(a) CT arrows indicate SAH. (b) Corresponding FLAIR image with arrows indicating SAH. SAH is shown similarly on FLAIR and CT. (c) SW image (d) SWI phase image. The SWI images highlight SAH (arrows) in different regions than the FLAIR adding complementary information. Images courtesy of Zhen Wu.
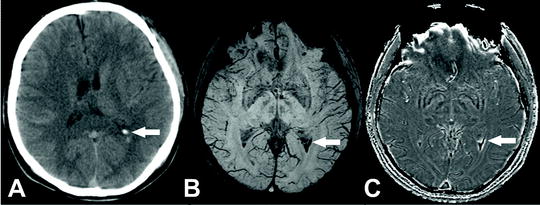
Fig. 2.
(a) CT arrow indicating blood in the ventricles from SAH. (b) SW image (c) SWI phase image. Both SWI images clearly depict the blood in the ventricle much more clearly and more completely than the CT. Images courtesy of Zhen Wu.
1.2 PD, T1-, T2-, and T2*-Weighted Imaging
One advantage of MRI is that there are numerous types of contrast (e.g., T1, T2, diffusion, spectroscopy, etc.) that are available to assist in the diagnosis of SAH. Standard T1- and T2-weighted images typically have very poor SAH contrast (7); however, other MR sequences can be very sensitive and specific for SAH (8). Proton density MRI was found to have similar findings in patients to that on CT at early time points (<6 or <12 h post-SAH). T1 was also reported to change but with less accuracy and only at >12 h (9, 10). Traditional T2-weighted imaging has also been useful for the evaluation of SAH but primarily within the context of monitoring edema, although if the region of extravasated blood is sufficiently large, T2 can visualize these changes.
T2*-weighted imaging (T2*WI) can be reliably used to identify regions containing blood products. T2* images are also very sensitive to SAH, having 94% sensitivity in the acute stage (<4 days) and 100% sensitivity in the subacute sage (>4 days). This is comparable to CT in the acute, and superior in the subacute periods (7). The iron in deoxygenated hemoglobin and blood breakdown products cause strong T2* shortening which gives excellent SAH contrast. However, T2* images are susceptible to artifacts near air–tissue interfaces and may obscure subarachnoid regions and prevent detection of SAH.
1.3 Diffusion-Weighted Imaging
Diffusion-weighted imaging (DWI) is often used in stroke as the neuroimaging modality of choice due to its sensitivity to ongoing tissue injury that is reflected by decreased proton diffusion. However, DWI and its quantitative parameter, the apparent diffusion coefficient (ADC), have not been routinely used in clinical or basic research with regard to SAH. However, several clinical reports have reported that use of DWI (or ADC) is useful for identifying ischemic tissue regions as a result of the SAH (9, 11–15). In virtually all of these clinical reports, the authors demonstrate that the DWI accurately reports the ischemic injury near the location of the SAH injury or in proximity to vessels where the SAH injury occurred.
Weidauer et al. (12) reported cortical banding infarcts after SAH that were visualized by DWI. Similarly, Sato et al. (13) demonstrated that aggressive clinical management of patients that showed DWI or ADC abnormalities, irrespective of the relative ADC (ratios) change, resulted in better outcomes for the patients. Other studies have also reported the value of ADC in SAH. Liu et al. (16) showed that ADC, but not T2-weighted imaging nor DWI, could detect broad changes in frontal lobe white matter that resolved over the course of 1 year.
Animal studies of SAH and DWI have been limited. Moseley and colleagues (17, 18) in a series of reports detailed the use of DWI to monitor the very early (within minutes) DWI and ADC changes following induction of SAH. They reported that shortly after SAH induction there was a pattern of diffusional changes within the brain that appeared to reflect the initial acute vasospasm that then appeared to initiate spreading depression, a wave of electrical depolarization, within the brain tissues. Others have reported use of DWI and have showed changes on DWI but no significant conclusions were reached (19).
1.4 Fluid-Attenuated Inversion Recovery Imaging
Fluid-attenuated inversion recovery imaging (FLAIR) is an excellent MR sequence as it suppresses all fluid signals within the brain allowing improved visualization of SAH in the absence of cerebrospinal fluid (CSF) or edema (Figs. 1 and 2). FLAIR is a T2-weighted sequence that has an inversion recovery pulse added to null the signal from CSF, which is normally very bright on T2 images. SAH causes a hyperintense signal on T2-weighted images. In a standard T2 image this hyperintensity would be hidden by the bright CSF, thus, nulling the signal from CSF allows SAH to be clearly visualized.
FLAIR was the first MRI sequence to reliably detect acute SAH (20). Since then FLAIR has been shown to detect SAH in many studies, particularly those comparing it to CT. In clinical settings, it has been shown to be at least as sensitive as CT (10). However, FLAIR and T2* MRI has been reported to overestimate the SAH or ICH volume while CT underestimates the lesion volume (21). In vitro models have shown it more sensitive than CT (22), and some animal models have shown FLAIR to be clearly better than CT as CT was inadequate to detect SAH in the reported model (23). However, in animal studies some caution is required in comparison to human data due to the type of SAH or ICH model that may change the visibility of lesions. An example is the study by Küker et al. who were able to visualize the ICH and SAH lesions at both 1.5 and 0.5 T on T2* and FLAIR with the authors reporting that FLAIR was optimal for SAH. In this study, the model used venous blood to induce the injury which could account for the improved visualization on MRI at the hyperacute time points (24).
1.5 Other MRI Modalities
Other MRI modalities have been reported but are not widely used either clinically or in basic research. These include the use of perfusion-weighted imaging (PWI), magnetic resonance spectroscopy (MRS), and derived parameters including relative blood volume maps. Spectroscopy for SAH injury markers from CSF of patients has also been performed but these are typically not used routinely in the clinic (3). A recent report of 31P MRS in patients receiving hypermagnesium therapy for SAH reported an effective therapeutic potential (25).
1.6 Susceptibility-Weighted Imaging
More recently, the introduction of susceptibility-weighted imaging (SWI) has vastly improved the ability to visualize extravascular blood deposition within the brain (Figs. 1 and 2). The technical and clinical applications relevant to adults have been recently reviewed by Haacke and colleagues (26, 27). SWI applications to pediatric cases have also been reviewed (28–30). While SWI is uniquely sensitive to blood and blood products within the brain, it has not been routinely used for SAH diagnosis nor clinical evaluation. One of the potential reasons for this is that the complementary phase information that is essential for the dramatic SWI contrast is problematic at air tissue interfaces, thus potentially making SAH diagnosis more difficult, particularly at the base of the skull. However, advances in phase mapping (31) and phase unwrapping (32) may alleviate this issues.
A recent publication evaluating traumatic SAH using SWI demonstrates the utility of this advanced technique for diagnosis (33). In 20 patients, the authors evaluated eight anatomical regions within the subarachnoid space and reported that SWI was able to identify five additional patients with SAH that could not be diagnosed with conventional CT.
Animal studies have reported increased sensitivity to blood products in experimental models (34, 35) (Fig. 3). In our own studies, we have shown that SWI, even using only the magnitude images, can delineate the sequence of events as extravascular blood is degraded within the brain (34). Since SWI is a new technique that requires additional filtering and postprocessing that are largely not yet available commercially from imaging manufacturers, we delineate a detailed protocol for acquisition, processing, and analysis of SWI-derived SAH data. Unequivocal imaging modalities, such as SWI will greatly spur both clinical diagnosis and advances in animal research allowing effective evaluation of potential therapies.
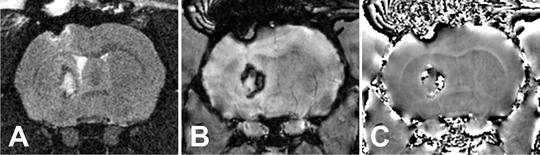
Fig. 3.
Rat intracerebral hemorrhage shown on (a) T2 (b) SW image and (c) SWI phase. The SWI is more sensitive to the blood products in the lesion while the T2 shows the edema triggered by the bleed.
2 Materials
The protocol outlined below can be used for any animal model of SAH, irrespective of the induction method. Additional instruments, materials, and research apparatus may be required for the induction of SAH. See Note 1.
2.1 Induction of Anesthesia for Neuroimaging
1.
Oxygen gas tanks.
2.
Isofluorane vaporizer and induction box.
3.
Isofluorane.
4.
Instrument with which to perform the pedal reflex test (application of pressure on a rat’s hind limb ankle joint results in the foot being withdrawn; reflex is absent in deeply anesthetized animals).
2.2 Imaging Equipment
To confirm the presence of an SAH lesion CT and/or MRI modalities can be employed. In addition, these modalities may pose a research benefit to the study depending on the focus of the project by the addition of quantitative imaging data. However, since we believe that SWI imaging is superior to CT and other conventional MR modalities (i.e., T2WI), we focus on acquisition of SWI. See Note 2.
When performing MRI on mice, one can use a Bruker Advance 11.7 T MRI (8.9-cm bore) with a 3.0 cm (internal diameter) volume radiofrequency coil (Bruker Biospin, Billerica, MA) or similar scanner/coil with comparable capabilities (Fig. 4). Imaging resolution on this instrument is on the order of ∼100 μm in all directions.
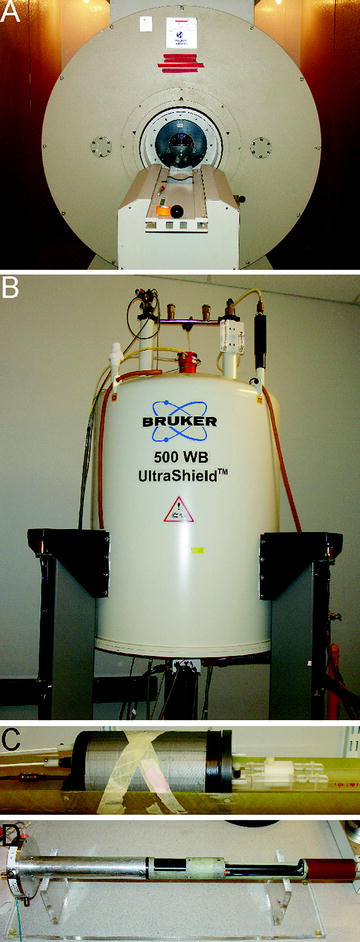
Fig. 4.
Noninvasive imaging methods. Our imaging suite has a Bruker 4.7 T MRI Scanner (a) and a Bruker Advance 11.7 T MRI (b) that can accommodate a range of experimental subjects (mice to dogs). A volume radiofrequency coil with animal handling including anesthetic nose cone (c) for the 4.7 T MRI and for the 11.7 T MRI scanner a similar volume radiofrequency coil (d) is available for mice and small rodents.
When performing MRI on rats, one can use a Bruker 4.7 T 30 cm horizontal bore instrument equipped with 250 mT/m microgradients (slew rate 1,000 mT/s) and a 116 mm (internal diameter) quadrature receiver coil or similar scanner/coil with comparable capabilities (Fig. 4). Imaging resolution on this instrument is on the order of ∼200 μm in all directions.
2.3 Analysis Materials
Upon completion of the MRI acquisition, analysis of the SAH lesion can be processed using a variety of methods. At the present time, the only commercially available program to process the SWI datasets is a clinical SWI package from Siemens. This automatically processes the SWI data during image reconstruction but gives no user selectable options. SWI analysis routines can be programmed in a variety of programming languages. We currently use a customized program, SPIN, that was developed by our collaborators (36) and can be made available to other researchers. Other groups have developed similar programs that are also made available to the researcher community (32). See Note 3.
3 Methods
3.1 Magnetic Resonance Imaging
Multicontrast MRI can be employed to visualize SAH in a noninvasive manner (Figs. 1–3). Under isofluorane anesthesia the animal can be placed either supine or prone positions on a bed that can be inserted into the MRI. This bed and how the animal is attached will vary between users. In our own laboratory, we place the animals in a prone position and the motion of the animal is minimized by use of a Delron plastic stereotactic holder (see Fig. 4c, d). Anesthesia gases flow through a nose cone similar to commercially available surgical stereotactic holders. To best visualize SAH, one can perform several imaging sequences, including FLAIR and SWI sequences in both coronal and sagittal planes of view using the following parameters; see Note 4:
Typical imaging parameters at 4.7 T are listed below:
FLAIR. TR/TE = 8,000 ms/40 ms, TI = 3,000 ms, NEX = 2, FOV = 2.8 cm, matrix = 2562, slices = 25, slice thickness = 1 mm, and slice interval = 1 mm.
SWI. 2D flow compensated GRE sequence, TR/TE = 1,250 ms/20 ms, NEX = 6, FOV = 3 cm, matrix = 2562, slices = 32, resolution 117 × 117 × 800 μm3, slice interval = 0.8 mm, and TA = 32 min.
These imaging sequence parameters can be altered as needed using the user interface on the MRI. A 3D sequence can also be used for SWI for a small increase in SNR by reducing the time to repetition (TR) to the minimum allowed amount with other parameters being kept the same. This will not typically result in an increase in imaging time. In our systems, we noted improved image homogeneity with the 2D sequence so have used this instead. See Note 5.
After the SWI magnitude images are collected, a special reconstruction of the phase data must be performed on the imaging console. These steps for a Bruker imaging system are delineated below.
1.


After the scan completes, clone the reconstruction.
< div class='tao-gold-member'>
Only gold members can continue reading. Log In or Register to continue
Stay updated, free articles. Join our Telegram channel
Full access? Get Clinical Tree
