Fig. 5.1
Infrarenal vena cava (IVC) stasis model, showing 48-h thrombus within the IVC (a) with ligation site at lower left, and after opening the IVC (b), with scale bar showing ~6.5 mm length of a mixed red and white thrombus
The major advantages of this model are its relative technical ease and the large size of the clot that can be removed and weighed to give an index of clot size. The length can also be measured as a further index of clot size. Additionally, the clot can be used subsequently for histologic or histomorphometric evaluation [20] or it can be subjected to Western blot analysis for thrombotic component analysis [21].
The primary weakness of this model is its use of abrupt vessel occlusion (via ligature) to induce thrombogenesis. Whereas clinical DVT and related venous thrombosis begin with a thrombus growth which progresses to vessel occlusion, the IVC stasis model uses the opposite – occlusion to induce thrombogenesis. The clot also develops in an upstream direction, opposite to that found with clinical DVT [22, 23]. Thus, the clinical relevance of this reversed thrombotic inductive process and direction of growth is questionable. There can also be considerable variability in clot size/length due to technical differences in model application and mouse vessel anatomic (variability). Of particular note is that operator skill and experience can vary the response; a more traumatic dissection for ligature placement or side/back-branch ligature or cauterization can augment the thrombotic response. The mouse venous system has a great capacity to reroute venous return normally carried by the IVC, and any overlooked small branches can occasionally maintain a flow channel that can prevent thrombus formation.
5.2.2 IVC Stenosis Model
A modification on complete IVC ligation was developed to create a stenosis [24, 25], a flow restriction of ~90 % of the cross-sectional area just upstream of the left renal vein to induce a low-flow state in the IVC. This is done by placing a spacer tube next to the IVC as the ligature is tied in its infrarenal location and then removing the spacer to create a narrow flow channel through the ligature – a stenosis. The most commonly used spacers are a blunted 30-gauge needle [26, 27], a ~0.36-mm wire [28, 29], or a piece of 5-0 nylon or polypropylene suture [24, 25].
Unlike the complete stasis model, the IVC stenosis model has a less than 100 % thrombosis rate in most hands [26–31]. Efforts to increase the thrombosis rate have focused on side and back-branch ligations/cauterizations [29] as well as the initial model development of introducing a moderate injury by briefly clamping the IVC distal to the ligature with a neurovascular or similar clamp [24, 25]. Work in my lab has found that even this approach is not reliable, with only a ~20 % (3/15) clot formation rate at 24 h, using a large bulldog-style clamp applied for two 15-s periods (Cooley, unpublished data). Others have reported ~50 % clot formation rates without using a clamp injury [31], further suggesting a high variability in clot formation among different operators. Furthermore, when the clot does form, the reported size/weight of the developing thrombus can have a large range and standard error [28], making comparisons among experimental and control groups less rigorous. The model is closer to what is envisioned as simulating clinical DVT due to flow restriction; however, as clinical DVT is believed to develop most often in a downstream direction from a valve pocket, the IVC stenosis thrombus develops in an upstream direction, an oppositely directed scenario which may weaken its clinical relevance. Because of the less than 100 % thrombosis rate, the model may be most useful for evaluating a thrombus-augmenting (prothrombotic) state. This might show both an increase in thrombosis rate and an increase in thrombus size and possibly both outcomes.
5.2.3 IVC Electrolytic Model
The concept of an electrolytic injury, using a mild positive-electric (anodal) current, to stimulate thrombus growth, was originally developed in a dog coronary artery thrombosis model [32]. Diaz and colleagues [33] have recently adapted this model to the mouse IVC. A 25-gauge angled needle with an indwelling silver-coated copper wire is inserted into the IVC near the iliac bifurcation, advancing it proximally and holding it against the inner wall of the IVC. A 250-μA constant anodal current is delivered for 15 min using a Grass stimulator, with cathode grounding to nearby tissue (e.g., skin wound edge), then the needle is removed from the IVC. Thrombus formation is consistently observed at 2 days, using a weight measurement and subsequent protein or microanatomic evaluations [33]. The primary advantage of this model is that it induces a reliable thrombus under flowing conditions without vessel occlusion, with the thrombus extending downstream from the site of application, thus simulating the purported clinical scenario for DVT development. Disadvantages include (1) the use of a substantial nonphysiologic thrombotic stimulus, an electrolytic injury which is applied to the inside of the vessel; (2) an extra needle puncture site for introducing the 25-gauge needle (adding an additional thrombotic injury); and (3) the need for a relatively expensive constant-current regulated electrical power source to generate the electrolytic induction of thrombus.
5.2.4 Femoral Vein Electrolytic Model
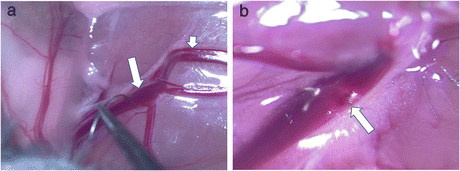
This model uses the same basic electrolytic process as described in the above model to induce a thrombus. The initial model [34] used a smaller microsurgical needle (70–130 μm in diameter) inserted into and against the inner wall of the femoral vein, with a constant voltage source for a shorter time (1–2 min) for thrombus induction. Subsequent studies found that a technically simpler approach [35] yielded a similarly consistent and cleaner thrombus, without adding the needle insertion injury site. The femoral vein is exposed in an anesthetized mouse by simple skin incision and directed retraction, without any other dissection; the vein surface becomes immediately accessible. The blunt end of a 75-μm microsurgical needle (Sharpoint, Surgical Specialties, Reading, PA) with the suture pulled out of the swaged end gives an easily held, iron-containing flat and circular area for contact onto the outer surface of the vein. The anodal (positive-current) end of a 1.5- or 3-V direct current source is easily connected to this wire by holding a connecting wire between the surgeon’s gloved finger and the metal instrument that holds the microneedle; the cathode of the power source is attached to local tissue such as the wound edge around the dissected site. Simple manual placement of the blunt end of the needle gently onto the surface of the vein completes the circuit (Fig. 5.2a) and generates a localized free-radical injury that transits through the vein wall to confer thrombogenesis (Fig. 5.2b). A mechanical hand or micromanipulator can also be devised to hold the needle against the vein, though for general, relatively brief applications, hand-holding of the needle is sufficiently steady and consistent.


Fig. 5.2
Photomicrographs of mouse femoral vein electrolytic application, showing (a) anode-connected blunt microsurgical needle touching surface of femoral vein (long arrow; with short arrow indicating distal saphenous vessels) and (b) visible thrombus seen within the femoral vein 30 min after the electrolytic injury (long arrow)
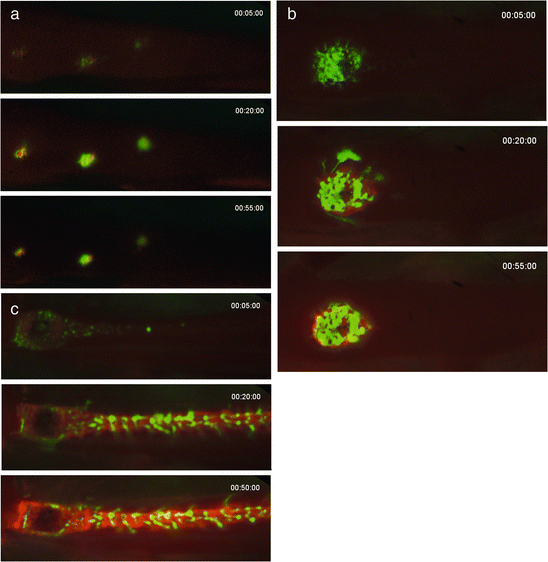
The contact can be left in place for a variable time, depending on the desired outcome, using a rough equation of [time] × [voltage] to calibrate a consistent injury. A 1.5-V delivery for 30 s yields a consistent, moderate size, nonocclusive thrombus. Even 1–2 s of delivery will induce a small, short-lived thrombotic response, whereas 3 volts applied for 90 s causes a far larger, extended thrombus (Fig. 5.3). This approach, surface-applied electrolytic injury, can be delivered to any vein large enough to have an exposed accessible surface from an intramuscular venule to the saphenous or epigastric vein (all in the same wound site as the femoral vein exposure) to the IVC.


Fig. 5.3
Intravital fluorescence imaging of brief electrolytic injuries to the femoral vein, showing platelet (green) and anti-fibrin (red) images of the thrombi at 5, 20, and 55 min: (a) three regions on the femoral vein surface received 2-s electrolytic injuries with a 1.5-volt application; (b) a 30-s injury; and (c) a 180-s injury. Flow in the vein is from left to right
The major drawback of this model is with the evaluation. The femoral vein is considerably smaller in diameter (0.5–0.6 mm) and shorter in length than the IVC (which is >1 mm in diameter and ~3–4 times longer); this smaller vessel limits the potential size of the ensuing thrombotic mass. Thus, measuring clot weight or length results in too small a datum for separation of experimental groups, with values too close to the limits of scale sensitivity and precise surgical extraction. The thrombus is also very small for other useful applications, such as Western blot analysis. To obtain a reasonable measure of thrombus size, histomorphometric analysis can be applied [34, 36] which involves a complete sectioning of the thrombus and careful area measurements of the clot at evenly spaced cross sections throughout the series, summing the areas to yield a volume estimate. The laborious process also only provides one time point per sample (as in the IVC models) taken at the time of harvest.
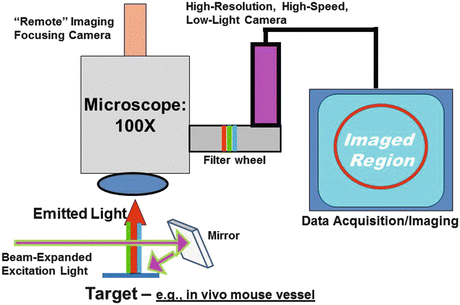
To overcome the limitations associated with femoral vein thrombosis in a mouse, an intravital fluorescence imaging system (Fig. 5.4) was developed in concert with the model [35]. A basic dissecting or operating microscope is used, either with inbuilt fluorescence capacity or with a custom-configured system integrated with a non-fluorescence/operating microscope (as developed by the author [35]). This system uses a 100-mm objective lens that allows magnification up to 100X and yields a 2.4 × 3.2 mm field in a C-mounted low-light digital camera, providing sufficient resolution for relatively fine features of thrombodynamic changes. The long working distance of the objective lens permits surgical manipulations before or during imaging. A filter wheel is incorporated between the microscopic optical path and the camera to allow flexible selection of emission-specific filters. An array of lasers for specific excitation wavelengths are combined with beam expanders (defocusing lenses) that spread each ~1-mm laser beam to a sufficiently large diameter (2–3 cm) to evenly illuminate the desired field of image capture. A shuttering system is used to limit this illumination via strobe synchronization with the camera shutter, to minimize photo-bleaching. The camera should have controls to permit digital video capture with control of both exposure time and between-exposure delays: this allows time-lapse video capture of a slow-growing thrombus. The lasers can be arrayed with horizontal beam paths adjacent to the microscope, using a mirror system to deflect the light onto the microscopic field of view (i.e., the surgical site of thrombus induction).


Fig. 5.4
Schematic of custom-designed intravital fluorescence imaging system. The excitation light (e.g., beam-expanded lasers) reflects off a mirror to the surgical field to induce emission in the target vessel, with image capture through a microscope-filter-camera-computer combination
For imaging a thrombus, a multitude of fluorophore-linked, thrombus-targeting compounds can be generated to query a variety of aspects about thrombodynamics. The number of fluorophores used in the same thrombus imaging session is primarily limited by the laser and filter sets available and their relative exclusivity. A standard setup [35] is to use a blue or green-yellow fluorophore matched with a red/near-infrared set, using one color for platelet labeling and one for an anti-fibrin antibody, which allows image acquisition for the two dominant structural components of a thrombus. Antibodies or peptides with binding affinities to a number of thrombus-specific targets can be fluorophore labeled and injected systemically, with thrombus site imaging to capture accumulating label. Platelets can be isolated from a donor mouse and membrane labeled for subsequent injection and detection of their accumulation. A standard approach [37–43] is to label platelets with rhodamine 6G or Vybrant DiD (Invitrogen), excited with green (532 nm) or red (650 nm) wavelengths, respectively, with simultaneous injection of a red- or green-labeled anti-fibrin antibody, respectively; this allows simultaneous evaluation of both platelet and fibrin development in a growing thrombus.
The primary advantages of this imaging approach combined with the electrolytic injury are multifold:
1.
The surgical exposure and thrombus induction are simple and quick (under 5 min).
2.
The thrombotic induction is clean, without any extravascular bleeding (e.g., from puncture holes) which can obscure imaging or give false-positive viewing of an intravascular thrombus.
3.
The electrolytic injury can be varied to generate larger or smaller clots simply by changing the applied voltage and/or the time of application.
4.
The developing thrombus can be imaged continuously for both qualitative and quantitative offline analysis.
5.
Offline analysis yields a direct quantitative evaluation of each fluorophore-linked thrombotic element over time, providing a wealth of data from each assay. By selecting a laser-excitation power density that optimizes image capture of a given fluorophore without camera saturation, the area of fluorescence can be combined with the average pixel intensity of each fluorophore to offer a relative net total fluorescence in each image (with background subtraction). By quantitating every image over time, the thrombodynamic profile for a given thrombus-targeting compound is generated. Adjustments can also be made for mouse weight (to estimate blood volume) and amount of injected fluorophore to permit normalizing of a group of data for between-animal and between group quantitative/statistical comparisons [35].
6.
The same in vivo model can be evaluated with different combinations of thrombus-targeting compounds (various platelet-specific receptors/integrins, coagulation cascade components and coagulation complex assemblies, and other cellular and plasma-carried elements [35]).
7.
Time-lapse image series can be developed into videos that speed up the viewing of an extended thrombodynamic process, thus showing, for example, a 1 h thrombotic growth and stabilization in around 15 s, overlaying images for color-specific identification of each thrombotic element.
5.2.5 Other Venous Models
Mechanical, chemical, and laser-injury induction mechanisms have been used on murine veins to stimulate thrombosis, though these approaches are less common and yield more variability in the thrombosis response. Pinching a vein [44] with forceps or a clamp will cause a mechanical injury to the wall with subsequent intraluminal thrombus development at the injury site. Ferric chloride has been used to generate a free-radical injury [45, 46], similar to the electrolytic injury, generally applied by placing a ferric chloride-saturated filter on the vessel surface for a brief (1–3 min) period; this method is more established in arterial thrombosis models (see below). Difficulty with reproducibility is a main contributor to the less frequent use of these models.
5.3 Arterial Thrombosis Models
There are three models of arterial thrombosis that are most commonly done in the mouse, all three of which use a form of free-radical generation to stimulate thrombosis. Several other models have also been developed but are less commonly used due to variability, technical difficulty, or both. All of these models are most often done in the common carotid artery, primarily because of the ease of dissecting and isolating a long, unbranched length for the manipulations.
5.3.1 Ferric Chloride Model
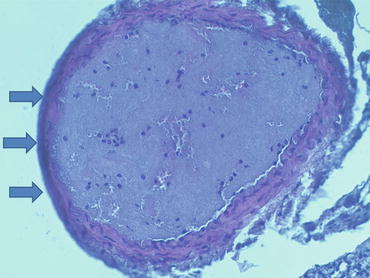
Originally described for the rat carotid artery [47], this model is easily adapted to the smaller mouse counterpart [48, 49]. The basic model uses a filter paper strip, usually 1 × 2 mm, which is soaked in a ferric chloride solution with a concentration by weight of 2–20 % [50]. This saturated strip is laid onto the surface of the common carotid artery for a specified period of time (generally 1–3 min). After its removal and washing of the vessel, flow in the artery is monitored with a flow probe (e.g., Transonic cuff) or similar ultrasound Doppler system. The outcome measure is most often the “time to occlusion” (TTO), the time from initial filter paper placement with baseline flow until the rate of flow approaches zero. Because of the difficulty in determining an absolute zero flow state with the available instrumentation, and because the fall in flow is generally rapid as it passed through 50 % and 25 % of baseline, the TTO is often based on the time to reach 50 % or 25 % of the baseline flow. Depending on the ferric chloride concentration and application time, and the particular mouse phenotype or antithrombotic treatment, some vessels may not undergo significant or even any flow reduction; a final end-assay time of 30 min is generally sufficient to identify whether or not an occlusive thrombus will develop. Most vessels that occlude remain occluded without any re-establishment of flow over the 30-min observation (Fig. 5.5). Some phenotypes/therapies will result in an unstable thrombus, for which an apparent TTO develops but partial or complete flow restoration is seen, sometimes showing the phenomenon repeatedly over 30 min. Decisions on how to treat these nonstandard data [51] should be made, ideally prior to running an assay. This model often requires a substantial number of animals per phenotypic group to obtain a suitable data set for comparison to other groups [52].


Fig. 5.5
Histologic cross section (H&E stain) of murine carotid artery 30 min after ferric chloride injury to vessel surface (blackened wall indicated by arrows on left). Thrombus is mostly composed of platelets, with occasional leukocytes and pockets of red blood cells
While ease of technical application and data collection has made this a popular model, there are several experimental drawbacks. As with many free radical-based injury models, the mechanism of injury which leads to thrombogenesis is incompletely understood [53, 54]. The data are non-Gaussian in nature, with a general limit on the shortest TTO and an infinite upper TTO that requires an arbitrary cutoff. Furthermore, the TTO is an indirect measure of thrombosis, the time at which a thrombus gets large and stable enough to occlude flow in the vessel. A slow-growing but thrombo-resistant clot might yield a longer TTO, which would be misinterpreted as a hypothrombotic response; conversely, a rapid-growing but possibly unstable clot may still yield an early occlusion (short TTO) that is interpreted as hyper- or prothrombotic. There is often a lag in the first few minutes before any substantial thrombus develops [55], even under prothrombotic conditions, making discernment of shorter TTOs from control TTOs difficult. Thus, despite its extensive utility, the ferric chloride model as an assay must be critically appraised in each application.
5.3.2 Rose Bengal Model
Intense light in a wavelength range of ~500–600 nm will stimulate singlet oxygen production by Rose bengal. When light is illuminated onto a localized area of the carotid artery of a Rose bengal-injected mouse, the generated singlet oxygen will confer molecular damage at the inner vessel surface, with subsequent thrombogenesis [56–58]. The light is generally applied continuously to maintain the damaging effect. The concentration of circulating Rose bengal plus the illumination intensity (power density, usually delivered by a 540-nm nitrogen laser) is calibrated to yield an occlusive thrombus, using the TTO (as with the ferric chloride model) as an endpoint measure (monitored with a flow probe). The TTO is generally longer than that for the ferric chloride model under similar phenotypic/pharmacologic conditions, suggesting that a milder but prolonged injury is needed to generate an occlusive thrombus with this model. Indeed, the need for continuous laser irradiation/stimulation implies that a somewhat different thrombodynamic process may be operative. The thrombotic occlusion can, as with the ferric chloride model, undergo cyclic reflow [57]. The equipment (laser) adds more to the setup for model development, but otherwise, it is quite similar to the ferric chloride in application, advantages, and shortcomings.
5.3.3 Arterial Electrolytic Injury Model
Surface application of an electrolytic injury can be done on the mouse carotid artery [35], similar to the description above in the venous version of the model. A stronger “dose” of electrolysis (iron deposition) is needed for the thicker-walled artery to generate a substantial injury; generally 3 V for 30 s is sufficient to create a large but nonocclusive thrombus, using a slightly larger microsurgical needle (130–140 μm in diameter) for charge delivery. The same intravital imaging approach (Fig. 5.4) as with the venous system is used for outcomes measures, selecting from a variety of potential thrombus-targeting, fluorophore-labeled compounds/cells. A simplified version of imaging can also be used, exploiting the “white” nature of the platelet thrombus and its exclusion of red blood cells to permit direct-light viewing/imaging of the developing clot and using an area measurement of this white region as an estimate for 3-dimension clot size/mass [59].
Stay updated, free articles. Join our Telegram channel

Full access? Get Clinical Tree


