Fig. 1.
Animal cradle for fixation in the MRI system. The half-pipe cradle (centre of the figure) holds the animal laid in prone position over the bed with the circulating warm water to keep the animal at physiological temperature. At left end of the half-pipe in the photograph, the fixation of the ear bars can be seen with the mask cone in between used for application of the breathing gases and the inhalation anaesthesia (the tooth bar is hidden in the mask cone). At the right end of the cradle, the connectors for the gas tubes and the warm water are positioned. Reproduced with permission from Medres company.
2.4 Quantitative MRI
MRI allows the measurement of various physical variables (Table 1). These are used – after evaluation and calibration – to depict a range of aspects from structural to haemodynamic and metabolic to functional parameters. Conventional experiments emphasize one particular parameter without excluding the others necessarily, thus weighting the contrast for a certain variable. This has the advantage of being fast, but the disadvantage that a non-weighted parameter can still generate a contrast, which was expected from the selected, originally weighted one, or that two parameters lead to low contrast because of competitive contrast mechanisms. Therefore, it may often be favourable to invest slightly more experimental scan time to record quantitative data of a single variable of choice: in these parameter maps, the contrast between tissue areas is generated from pure difference in the selected parameter in these tissues (9, 10). This makes interpretation of the pathophysiological cause of the contrast unambiguous.
Table 1
Physical MRI variables and their use of in vivo imaging
MRI variable | In vivo application |
|---|---|
Structural information | |
T1 relaxometry | Blood-brain barrier intactness |
(+ Gd chelate contrast agent) | |
T2 relaxometry | Anatomic contrast |
Vasogenic edema | |
Chronic ischemic lesion | |
Apparent diffusion coefficient (ADC) | Acute ischemic lesion |
Diffusion tensor imaging (DTI) | Fibre orientations |
Haemodynamic information | |
Perfusion-weighted imaging | Tissue perfusion |
T2*-weighted imaging | CBV, CBF, MTT (+contrast agent bolus) |
Metabolic information | |
ADC | Ion and water homeostasis (ATP dependent) |
Functional information | |
Manganese-enhanced MRI (MEMRI) | Axonal tracing |
DTI | Connections of brain nuclei by fibres |
Resting-state functional MRI (rs-fMRI) | Brain connectivity network |
fMRI | Stimulus-specific brain activation |
2.5 Structural Damage Registration
In order to choose the best measurement sequence, it is necessary to have prior knowledge of the pathophysiological cascade of events during the window of observation (11).
2.5.1 Early Phase of Stroke Evolution
Rapidly after the onset of ischemia, cell respiration fails and the ATP pool is depleted. The cells depolarize, as they no longer can maintain ionic gradients across their membranes. In consequence, osmotically driven inflow of water into the cells leads to a reduction of the apparent diffusion coefficient (ADC) (12). ADC measurements, thus, show a significant reduction by approximately 30–40% in the ischemic core, depicting the ischemic territory very early and with sensitive contrast (13). Quantitative analysis of the degree of ADC reduction and correlation with the tissue area of energy breakdown has led to an ADC threshold for a severely damaged ischemic core region and a further threshold for the metabolic penumbra characterized by anaerobic glycolysis and tissue acidosis (Fig. 2) (14).
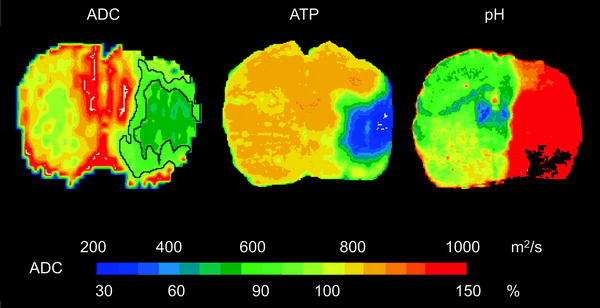
Fig. 2.
ADC thresholds for ischemic core and penumbra. Coronal images of ADC (left ), distribution of ATP (centre) and tissue pH (right ) after 2 h of MCA occlusion are depicted. The area of tissue acidosis is clearly larger than the region of ATP depletion. For comparison, the corresponding area sizes are outlined in the ADC image, thus indicating the two different ADC thresholds (77% of normal for the ischemic core, 90% of normal for the penumbra). Reproduced with permission from (14).
In a permanent occlusion model, the ADC reduction persists for a few days, then increases again to produce a pseudonormalization, followed by an ADC value above normal (15). These changes reflect the pronounced expression of the vasogenic edema during the first week post-stroke, followed by the cystic transformation. In an early reperfusion situation, the ADC may normalize very quickly in relation to rapid recovery of the energy metabolism (16, 17). With several hours delay, a secondary decline of the ADC occurs in the same territory that was characterized by ADC reduction at the end of the primary occlusion period. Thus, within the first few hours after successful reperfusion, the ADC may severely underestimate the damage in the ADC maps (Fig. 3).
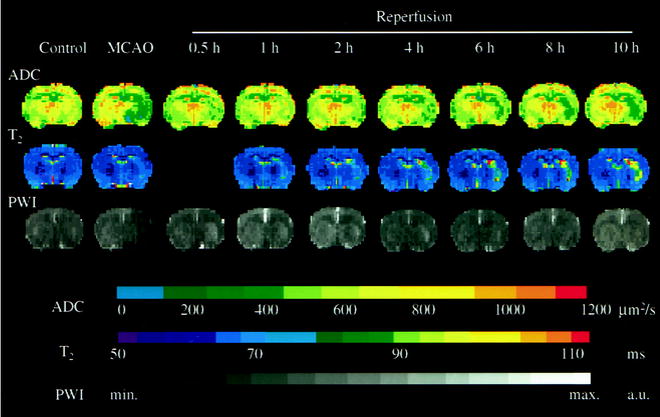
Fig. 3.
Representative time course of apparent diffusion coefficient (ADC), perfusion-weighted signal intensity and T2 maps before ischemia (Control), at the end of middle cerebral artery occlusion (MCAO) and at different time points of reperfusion. Note the transient recovery of ADC at the early phase of reperfusion, followed by secondary deterioration. The increase of T2 value was continued in the lesion area during early recirculation. Perfusion-weighted signal intensity images did not reveal significant delayed hypoperfusion after retraction of the occluder. Reproduced with permission from (16).
Another parameter commonly applied is the T2 relaxation time. T2-weighted images show the early vasogenic edema as hyperintensity after a few hours (18). This hyperintensity persists and increases to its maximum at approximately 1 week after stroke onset. T2-weighted imaging, however, is not sensitive enough to detect the beginnings of T2 increases during the very early phase of the vasogenic edema with sufficient contrast (16). Quantitative T2 maps, on the other hand, allow the reliable detection of the ischemic territory even within an hour of stroke onset (16). This T2 increase is not reversible during early reperfusion when ADC transiently normalizes again. Moreover, the further development of T2 during this reperfusion phase – a further increase or stagnation – has been described as a good indicator for the severity of damage (16).
MR angiography provides information about the vascular occlusion and the position of a clot in thromboembolic stroke models (19). This contrast agent-free angiographic method allows repetitive screening for success of lysis. Together with perfusion MRI, it offers a detailed haemodynamic characterization of the occlusion period: vascular occlusion and reopening, tissue perfusion and collateral supply (despite occlusion of the main vessel).
T1-weighted MRI can be used together with iv injection of a gadolinium contrast agent to depict disturbances of the blood-brain barrier (BBB) (20). In the regions of open BBB, the contrast agent leaks out of the vascular bed into the parenchyma, inducing a T1 reduction in the tissue and thus resulting in a diagnostic hyperintensity.
2.5.2 Chronic Phase of Stroke Evolution
In the chronic phase, ADC and T1-weighted imaging are of little help, particularly as the pseudonormalization phase may veil the pathophysiological processes, thus leading to false negative interpretation. T2-weighted imaging is the most widely used parameter for presentation of the lesion extent in the chronic phase. It should be noted, however, that even T2 maps carry the risk of false interpretation due to the development of T2 contrast over time: After the first wave of T2 increase during the pronounced expression of the vasogenic edema, T2 normalizes again in parallel with the resolution of the edema (21). This T2 normalization will continue if the lesioned tissue develops only selective neuronal death. In the case of pannecrosis with following cystic transformation, however, a second T2 increase occurs at this time. Thus, the time profile of T2 during the chronic phase is indicative of pannecrosis while a lack of T2 increase may be interpreted either as tissue recovery or selective neuronal death (21, 22).
Finally, during the late phase, several weeks after stroke induction, a hypointensity may appear in T2*-weighted images in some areas of the ischemic territory. The reason for this T2*-sensitive hypointensity was found to be iron accumulation in macrophages around vessels with delayed degradation. Iron ions of erythrocytes, entering the parenchyma through vascular leaks and incorporated by the macrophages, are the source of the image contrast, thus serving as sensitive monitor of delayed vessel degradation and ensuing macrophage activity (23, 24).
2.6 Functional Connectivity
The study of a focal lesion, such as stroke, may also inflict only local functional deficits. However, it is also conceivable that areas distant to the primary lesion site are affected or that plastic reorganization processes point to interactions between the lesion and close or even distant brain areas. Thus, the focal lesion may have repercussions on a whole network of interacting areas. In order to better understand the whole consequences of the damage and also the underlying mechanisms of any observed functional improvements, it is of great interest to investigate the connectivity of the brain as a whole, before and at times after lesion induction. Here, several recently developed methods of in vivo MRI contribute to these investigations. The following three paragraphs introduce axonal tracing, fibre tracking and resting-state connectivity measurements as important tools.
2.6.1 Axonal Tracing
Manganese ions are taken up by cells in a similar way to calcium because of their same charge and van der Waals radius. After incorporation into vesicles, they are transported anterogradely along the axons and are even passed on transsynaptically (25, 26). Due to their electron configuration, manganese 2+ ions act as efficient T1 contrast agent – this effect is exploited for Manganese-Enhanced MRI, MEMRI. Thus, transport of manganese ions from the local injection site of manganese chloride can be followed in vivo. This can be used to trace connections and assess the intactness of a connection (27). Appearance of manganese-induced T1 contrast in the thalamus after local injection into the somatosensory cortex, thus, demonstrates the intact cortico-thalamic connection while lack of hyperintense signal in the thalamic nucleus would indicate loss of the axonal pathway.
< div class='tao-gold-member'>
Only gold members can continue reading. Log In or Register to continue
Stay updated, free articles. Join our Telegram channel

Full access? Get Clinical Tree


