CHAPTER 46 Metabolic and Nutritional Diseases of the Puerperal Period
Metabolic adaptations associated with the transition from pregnancy to lactation take place in all cows, including those that are well fed. These metabolic changes may become exaggerated, however, when maternal supplies of glucose, protein, or calcium (Ca), or any combination thereof, are inadequate, thus leading to metabolic disease problems. A poor transition is evidenced by slow or cyclic feed intake, excessive body condition loss, and high prevalence of metabolic and infectious diseases during the puerperium, followed by poor lactational performance.1 Milk production in dairy cattle with periparturient disease is differentiated from that in nonaffected cows by low first-test and peak milk production and altered composition, typically a high (>1.5) fat-to-protein ratio.2 As previously characterized, perturbed transition also accounts for poor reproductive performance3 and increased involuntary cull rate.4,5
DISEASES OF ENERGY BALANCE
All dairy cows, and to a lesser extent beef cows, experience a period of negative energy balance immediately before and through 4 to 6 weeks after calving. A variety of metabolic, hormonal, homeorhetic, and environmental factors influence individual cow response to negative energy balance and associated health, productive, and reproductive consequences. Metabolic alterations associated with the transition from pregnancy to lactation and their impact on substrate metabolism are described in Chapter 57. A cow’s inability to maintain homeostasis of key metabolites during the transition period is prerequisite to a variety of periparturient diseases. Severe or prolonged negative energy balance resulting in rapid and excessive lipid mobilization, coupled with perturbed nonesterified fatty acid (NEFA) metabolism, a consequence of an inability to maintain glucose homeostasis, manifests in a number of clinical and subclinical syndromes of ketosis and fatty liver infiltration. To some degree, hepatic lipidosis usually precedes and is concurrent with development of deranged fatty acid metabolism, but fatty infiltration can become excessive and become a clinical entity itself. Several excellent detailed reviews of negative energy balance and its relationship to the pathogenesis of ketosis and hepatic lipidosis are available.6–10
Elevated blood NEFA concentration is requisite to excessive hepatic NEFA uptake as absorption is directly proportional to concentration.11 Metabolic fate of absorbed NEFAs in the liver is limited primarily to partial oxidation (ketogenesis) or esterification to triglycerides (lipogenesis). Complete oxidation in peroxisomes and triglyceride export as very-low-density lipoproteins (VLDLs) are other disposal pathways for NEFA but are limited options in ruminant animals. Availability of glucose coupled with current metabolic milieu determines the fate (lipogenesis or oxidation) of absorbed NEFAs in the liver.12 Ketosis is characterized by an excessive accumulation of ketone bodies when glucose availability is limited.
Kronfeld13 suggested differentiating ketosis syndromes on the basis of underlying pathogenesis. Spontaneous or primary clinical ketosis was defined as a disease syndrome independent of an initiating disease process. This is in contrast with secondary ketosis, in which the ketotic state is induced by a primary disease process further exacerbating negative energy balance. Alimentary (or dietary) ketosis is defined as a ketotic state resultant from consumption of excessive ketone bodies or their precursors within the diet. Ensiled feeds exhibiting a clostridial fermentation will contain an increased amount (>1%) of butyric acid as a proportion of total volatile fatty acids (VFAs). Butyric acid is converted to β-hydroxybutyrate (BHB) by the rumen epithelium, which can contribute significantly to ketone body production. Subclinical ketosis is defined as elevation of blood ketone concentration (>14 mg/dl) in the absence of clinical signs of ketosis.14
Glucose supply is determined by fractional rate of hepatic gluconeogenesis and glucogenic substrate availability, given that minimal dietary glucose is directly available as a result of ruminal fermentation. Holtenius and Holtenius15 suggested further characterizing spontaneous clinical ketosis into types I and II, based on differences in metabolic derangements of glucose homeostasis. Cows unable to meet glucose demands of milk production exhibit the metabolic underpinnings of type I ketosis: gluconeogenesis is maximized but sufficient glucogenic substrate is lacking.15 These cows are severely hypoglycemic and have low insulin-to-glucagon ratios, thereby facilitating a catabolic state utilizing amino acids for gluconeogenesis. Absorbed NEFAs are metabolized almost exclusively to ketone bodies to provide alternative energy substrate for tissues in an effort to increase glucose availability and to minimize detrimental effects of excessive body protein catabolism. This metabolic description is consistent with classic spontaneous ketosis associated with high milk production in early lactation; accordingly, the term peak lactation ketosis7,12 is used for this entity in this chapter.
Another ketotic syndrome, type II ketosis, occurs more immediately around parturition and is characterized by moderate hyperketonemia, greater hepatic fat infiltration, and moderate hypo- to normoglycemia.7 Metabolically, neither gluconeogenesis or ketogenesis is maximally stimulated, and more NEFAs are directed to esterification in these cows. As fatty infiltration increases, gluconeogenic capacity is compromised, ultimately leading to reduced glucose availability and increased ketogenesis.12 Holtenius and Holtenius15 attributed type II ketosis to insulin resistance and impaired glucose utilization as a result of dry period overfeeding and hence equated the syndrome to type 2 diabetes mellitus. Periparturient ketosis is a descriptive term suggested for this type II ketosis syndrome,12 to be differentiated from peak lactation ketosis.
Clinical Signs
Cows affected with primary ketosis will not present different from any other early-postpartum cow experiencing one or more typical periparturient diseases. Careful physical examination should be completed to determine presence of current disease. Progressive loss of appetite and milk production over a period of a few days is a typical presentation for peak lactation ketosis.12,16 Milk production losses vary depending on when energy equilibrium relative to dietary intake is established but may become severe, exceeding a 50% reduction in previous production. Ironically, cows will select against grain consumption, further exacerbating their energy deficit and, in conjunction with reduced dry matter (DM) intake, will rapidly lose body weight and condition. Affected cows often have a rough appearance, look gaunt and “tucked up” in the abdomen, show moderate depression, and have a sweet acetone smell to their breath. Vital signs typically are normal, with decreased rumen motility and firm, dry feces of reduced volume. A small proportion of ketotic cows (10%) will present with neurologic signs including abnormal licking, head pressing, circling, and walking blind.16,17 Nervous ketotic cows may periodically show hyperesthesia, ataxia, tremors, or tetany, which may be confused with other neurologic diseases. The mechanism responsible for neurologic signs is unknown, and an individual cow’s clinical presentation is not associated with blood ketone concentration. Most commonly, cows present with peak lactation ketosis between 3 and 6 weeks post partum, a period characterized by rapidly increasing milk production and lagging DM intake.
Cows experiencing periparturient ketosis will present with clinical signs similar to those in cows with peak lactation ketosis, with the following differences. Time of presentation occurs earlier, typically 7 to 10 days relative to calving, and cows have higher (>3.75/5.0) body condition score (BCSs). By definition, cows with subclinical ketosis show no diagnostic clinical signs, but herds experiencing problems with energy balance and high prevalence of subclinical ketosis may show lower milk production, reproductive inefficiency, and higher than expected prevalence of left displaced abomasum. Subclinical ketosis occurs during the same time frame as for clinical ketosis and most often is seen at approximately 4 weeks post partum.14
Clinical signs in cows with fatty liver are similar to those in cows with periparturient ketosis, and fatty liver may represent a more severe form of this disease. Affected cows typically present with clinical manifestations around the time of calving and have excessive body condition at the time of dry-off.18 At presentation their BCS may be slightly reduced. Clinical fatty liver disease is more common in older cows but can be seen in primiparous cows.18,19 Severity of hepatic fatty infiltration will determine additional accompanying clinical signs and secondary metabolic and infectious disease processes.10 Morbidity and mortality rates in cows experiencing concurrent periparturient diseases and reproductive inefficiency increase with degree of fatty infiltration. Cows with severe fatty infiltration (>10% wet weight) will be extremely anorectic and depressed and may show neurologic signs.19 These cows also show very poor response to therapies targeted at concurrent diseases, possibly a result of impaired immune function10,20 and hepatic gluconeogenesis21 and ureogenesis.22 Even with aggressive therapy, death and culling rates are greatly increased among clinically affected cows.18,19
Diagnosis (Individual and Herd)
Ketosis
Definitive diagnosis of ketosis in an individual cow is established by measuring excessive concentration of ketone bodies in blood, milk, or urine. Signalment, clinical signs, and a thorough physical examination will suggest the form of ketosis present. Acetoacetate, acetone, and BHB comprise the ketone bodies generated from partial fatty acid oxidation. Acetoacetate and acetone account for only 10% to 20% of total ketone bodies, but this proportion increases during ketosis as acetoacetate production is greatly increased. As a result of acetoacetate instability in harvested blood specimens, however, measurement of more stable BHB concentrations typically is used in diagnosing ketosis with blood samples. Total blood ketone or BHB concentration in excess of 30 or 25 mg/dl, respectively, generally is considered a threshold for clinical ketosis.12 Ketone bodies are concentrated in urine at 2 to 4 times blood levels; thus, total urinary ketones often exceed 80 mg/dl.12,17 By contrast, milk ketone concentration is 40% to 50% of blood concentration; therefore, milk total ketone concentrations of 10 mg/dl or greater are found in clinical ketosis cases. Cows with peak lactation ketosis generally have more profound ketonemia (blood ketone level >40 mg/dl) compared with those with periparturient ketosis.12 Based on greater risk association with clinical ketosis and displaced abomasum and reduced milk production, subclinical ketosis in cows was defined as blood BHB concentrations greater than 14 mg/dl (1400 μmol/L).14 Milk acetoacetate or BHB concentrations greater than 1 mg/dl (100 μmol/L) are considered indicative of subclinical ketosis.14
To facilitate cow-side diagnosis, a number of semiquantitative commercial tests are available for estimation of ketone body concentration in milk or urine. Powder or test strips based on the nitroprusside reaction measure acetoacetate concentration, whereas a newer test kit (Ketolac-BHB or Keto-Test) measures milk BHB concentration. As a result of its concentrating property, evaluation of urine ketone concentration results in an overestimation of ketosis prevalence, whereas milk ketone concentration underestimates ketosis prevalence. Studies evaluating cow-side test sensitivity and specificity relative to blood BHB concentration suggest using a threshold value of 1 mg/dl (100 μmol/L) of either milk acetoacetate or BHB as a good indicator of subclinical ketosis.14,23,24 More recent work suggests that using a time-restricted (5 sec) interpretation of urine ketones (Ketostix) can be as accurate as milk ketone evaluation.25
Fatty Liver
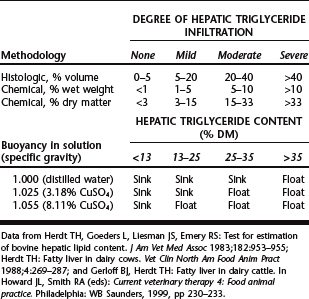
Definitive diagnosis of hepatic fatty infiltration is determined by direct measurement of triglyceride content from a liver biopsy sample. Hepatic triglyceride content can be determined quantitatively by chemical methods or semiquantitatively by histologic volume or flotation methods18,19,26 (Table 46-1). Ultrasound examination holds some promise as a noninvasive method to categorize liver fat content.27
Various liver function tests have been used to evaluate degree of fatty infiltration relative to clinical severity of ketosis and hepatic lipidosis. A wide variety of serum biochemical tests were evaluated for their ability to predict severity of hepatic lipidosis and hepatic function. Nearly all tests were of questionable value diagnostically and prognostically, as a result of their nonspecificity for liver function and minimal association with degree of liver fat content.18,19,28 Biochemical measures of aspartate aminotransferase (AST), sorbitol dehydrogenase (SDH), and total bilirubin were significantly increased with severe hepatic lipidosis; however, most such measures were of low specificity.28 Cows with severe hepatic lipidosis also tend to have much lower serum total cholesterol concentrations (<70 mg/dl), reflecting a reduction in total circulating lipoproteins.19 Although not specific for liver function, elevation of AST (>100 U/L) has been suggested as the best supportive evidence of hepatic fatty infiltration.18,19,28
Herd Diagnostics
More important than individual cow diagnosis is determination of herd risk for ketosis, fatty liver, or both. Herd diagnostics can be based on selective metabolic profiling and dairy production records evaluation. Serum NEFA concentrations ante partum and post partum can be used to evaluate risk for excessive negative energy balance. Serum samples are collected from a minimum of seven animals in the prefresh (−14 to −3 days) and postfresh (<30 days) groups. If more than two samples have NEFA concentrations exceeding 0.4 mEq/L (ante partum) or 0.7 mEq/L (post partum), then these groups are at higher risk for periparturient disease and subclinical ketosis.23,29 Similarly, serum BHB concentration can be measured in selected early postpartum animals to evaluate risk of subclinical or clinical ketosis. If more than two samples out of 1023 or 1229 total samples with BHB concentration exceeding 14.5 mg/dl (1400 μmol/L) is suggestive of increased herd risk for subclinical ketosis.
Given the association between ketosis/fatty liver and lower milk production, herd records can be used to evaluate milk production in early lactation cows. Lower than expected first-test-day milk or low peak milk relative to overall herd production indicate potential transition cow problems. Lower 305-day mature equivalent (305ME) milk production for early-lactation than for later-lactation cows also indicates possible transition cow problems. Lower early-lactation milk production, however, is not specific for ketosis or fatty liver but reflects problems associated with most periparturient diseases.2
Alterations in milk composition, primarily fat as a result of increased lipid mobilization during negative energy balance, seem to better reflect risk for ketosis and fatty liver. Milk fat content is elevated in clinical and subclinical ketotic cows,14 a result of increased NEFA delivery to the mammary gland from fat mobilization. Herds in which milk fat content is elevated in 20% of the cows or greater (5% in Holsteins, 6% in Jerseys) on first test date are undergoing rapid fat mobilization and are at greater risk for ketosis. A better indicator of herd ketosis risk is protein-to-fat ratio. A milk crude protein–to–fat ratio of 0.75 (1.33 fat-to-protein ratio) on first test date in 40% or more cows suggests that the herd is at greater risk for ketosis.23,30 Cows with a milk fat–to–crude protein ratio greater than 1.5 were 3.2 times more likely to have clinical ketosis.2 Conversely, cows with ketosis before first test date were 4.4 times more likely to have a high fat-to-protein ratio (>1.5); however, these cows also were at greater risk for other periparturient diseases.2
Treatment
Fundamentally, ketosis treatment objectives of glucose replacement and reducing fat mobilization have not changed over the past 50 years.31–33 Bolus intravenous glucose or dextrose (250 g; 500 ml of 50% solution) in conjunction with intramuscular glucocorticoid administration (0.03–0.04 mg/kg dexamethasone [Azium, Schering] or isoflupredone acetate [Predef 2X, Pfizer]) is surprisingly effective in many cases of clinical ketosis. Glucocorticoid therapy without glucose administration is less efficacious.34 Initial therapy is followed by continued supplementation with glucogenic substrates and appetite stimulants.
Cows with periparturient ketosis are less responsive to bolus glucose administration than are cows with peak lactation ketosis, most likely because of confounding effects of fatty liver. Although peak lactation ketotic cows respond quickly to glucose therapy, relapses occur, often necessitating repeated therapy. Daily bolus glucose therapy may be needed over a 2- to 4-day period for full recovery. Hyperglycemia mediated by bolus glucose administration is short-lived but induces a marked decline in NEFA release35 and ketone production36 and stimulates insulin36 release. Fructose and sorbitol have been advocated as alternative glucose substrates to prolong the hyperglycemic effect. These compounds are exclusively metabolized to glucose by the liver and not appreciably utilized by peripheral tissues. No therapeutic advantages of these sugars over glucose have been found.16,33 Xylitol may hold some therapeutic advantage.37
An alternative to daily injections is continuous glucose infusion for difficult or refractory cases or for cows with periparturient ketosis and fatty liver. Infusion of 20 L of 2.5% glucose in normal saline over 24 hours is suggested.17 Such intensive infusion therapy may not be practical in many situations but is of value in genetically superior animals and for treatment of more severe hepatic fatty infiltration. Urine ketones should be monitored for response, and blood glucose concentration should be monitored after therapy to detect possible rebound hypoglycemia.
Insulin plays multiple regulatory roles in fat and glucose metabolism that would be beneficial in ketosis therapy. Insulin is a strong suppressor of adipose NEFA release and ketogenesis and facilitates peripheral tissue uptake of ketone bodies and glucose. Low doses of long-acting insulin every 24 to 48 hours, along with glucose infusion or glucocorticoid therapy, have been found to be effective.17,33 Previously, 200 to 300 U of protamine zinc insulin every 48 hours was used, but this agent is no longer available. Human recombinant insulin (25 IU/100 kg of Ultralente) every 24 to 48 hours has been advocated as an alternative insulin source.17 In one study, use of a slow-release insulin (0.14 IU/kg) showed promise for treatment of ketosis and fatty liver.38 In this study, higher dosages (0.29 or 0.43 IU/kg) resulted in adverse hypoglycemia.
A variety of glucogenic substrates—namely, glycerol, propylene glycol, and propionate salts—can be provided orally as a drench or feed additive to complement glucose therapy and maintain substrate to support gluconeogenesis.31,37,39–42 Propylene glycol (1,2-propanediol) is most commonly used at a typical dose of 225 to 400 g (8 to 14 oz) orally twice daily.33 Excessive dosing of propylene glycol (>800 g) may have adverse effects on rumen function and neuromuscular activity.33,37 Glycerol can be administered at 500 g twice daily (1 L/day).43,44 Sodium (Na),31 Ca,39,40 or magnesium (Mg)37 salts of propionic acid can provide glucogenic substrate, as well as readily available mineral. Dosage ranges from 50 to 250 g twice daily administered as a drench or applied to the feed. Caution must be taken to avoid oversupplementing mineral from these propionic acid salts. All of these glucogenic substrates are metabolized to glucose by the liver. In the face of liver dysfunction due to fatty infiltration, efficacy of these substrates is questionable.
Treatment approach to fatty liver should reflect severity of fatty infiltration and underlying etiologic disorder. Treatment objectives of establishing glucose homeostasis and minimizing lipid mobilization mimic those in ketosis. A paucity of studies exist defining efficacy of therapeutic protocols for fatty liver. Most promising is the potential therapeutic application of continuous glucagon infusion for treatment of moderate45 or severe46 fatty liver. Glucagon therapy also shows possible application to periparturient ketosis, because impaired gluconeogenesis is hypothesized as an underlying concern.12 Fatty liver therapeutic protocols should undertake aggressive ketosis therapy coupled with good enteral nutritional support.
Beyond initial therapeutic procedures, cows with ketosis and especially fatty liver can benefit from various supportive therapy modalities. With various degrees of inappetence, a common presentation, stimulation of appetite is critical. Often B-vitamin solutions, typically B12, are administered to nonspecifically stimulate appetite. Offering fresh-cut grasses or a variety of feeds may help stimulate intake in some cows. If rumen function is compromised, rumen transfaunation may be required to stimulate intake. Force-feeding gruels to provide substrate for rumen microbes may be necessary in more severe cases of fatty liver. Gruels should contain sufficient fermentable fiber sources (beet or citrus pulp, wheat middlings), protein (alfalfa meal, soybean meal, distillers’ grains) and fermentable energy sources, but in limited amounts to minimize acidosis potential. Complete commercial cow pellets often have been used to make gruels if individual feed ingredients are not readily available. Finally, because ketosis and fatty liver often are complicated by a number of secondary disorders, the overall treatment plan should include needed therapy to address these diseases.
Prevention
Emphasis has been placed on increasing dietary energy density in the immediate prepartal diet, compensating for decreasing DM intake, in an effort to minimize negative energy balance and predisposition to ketosis and fatty liver.47–49 Minor and colleagues showed positive effects of increasing dietary content of nonstructural carbohydrate (NSC) (i.e., sugars and starches) on energy balance and liver fat infiltration.50 When rumen-fermentable carbohydrates are increased, however, metabolizable protein supply also is increased, suggesting that energy and protein in ruminant diets are not independent. Cows fed a high-energy and high-protein prepartal diet had lower serum NEFA concentration, NEFA-to-cholesterol ratio, and fatty liver score compared with cows receiving high-energy, low-protein or low-energy, low-protein diets.51 The association of high-energy, low-protein prepartal diets with hepatic lipidosis is consistent with the original case descriptions of fat cow syndrome.52,53 Cows afflicted with either ketosis or hepatic lipidosis were found to have lower serum apoproteins associated with VLDL structures, suggesting an inability of the liver to export triglycerides.54 Limited supply of methionine and lysine has been suggested to reduce VLDL production and predispose to hepatic lipidosis.55,56 Protein content of the prepartal diet above National Research Council (NRC) recommendations has been associated with decreased ketosis incidence,57,58 but positive metabolic response to protein has not been consistent across all studies.48,59 In view of the multiplicity of roles amino acids play in glucose and lipid metabolism, potential exists for mediation of periparturient disease by manipulating metabolizable protein supply, but mechanisms are still not well understood. Part of the problem with animal response to diet may relate to confounding effects of BCS on dietary feeding strategies.60,61
Management practices related to feed intake and nutrient supply are equally important, if not more so, in preventing adverse responses to negative energy balance. Dry cows with obese body condition (BCS of 4 on a 5-point scale) are more predisposed to fatty liver10 and ketosis.12 BCS management must start in mid- to late lactation, in view of the inability to dramatically increase or decrease BCS during the dry period. Optimal range in dry cow BCSs is 3.0 to 3.75 (on a scale of 1 to 5), with a greater percentage of cows having 3.25 or 3.5 BCS. Proper feed bunk management should focus on ensuring appropriate feed quality, adequate feed availability (>21 hours/day), cow bunk space (30 inches per head), and water availability and quality. Grouping strategies, stocking density, and pen movements should consider cow social behaviors and the expression of agonistic interactions, often resulting in reduced feed intake with exacerbation of negative energy balance.62 Suggested stocking density for free stall systems, based on observed DM intake effects, is less than 90%. Minimum suggested space per cow for free housing systems is 80, 100, and 120 square feet for far-off dry, close-up dry, and maternity cows, respectively. Additionally, environmental conditions of cold and heat stress need to be addressed. Behavioral and physical facility management issues related to transition cows recently have been reviewed.62
A number of dietary supplements and feed additives have been advocated to prevent ketosis and fatty liver. These supplements either act as lipotrophic agents (niacin, choline), helping the liver to process lipid better, or improve availability of glucogenic substrate (glycol, propionate, monensin sodium [Rumensin, Elanco]). Niacin (or nicotinic acid), fed at 6 g/day starting 2 weeks ante partum and 12 g/day at calving through 90 days in milk, has been shown to reduce ketosis incidence63 and to increase milk production.64 Not all niacin supplementation studies, however, have shown metabolic responses consistent with ketosis prevention.50,65 Obese cows may respond more favorably to niacin supplementation, as a result of its antilipolytic activity. Niacin is degraded in the rumen,64 which may limit efficacy with oral supplementation.
Choline, a methyl donor and constituent of phosphatidylcholine, facilitates hepatic lipid export by increasing VLDL formation. Similar to niacin, choline is readily degraded in the rumen, necessitating delivery in a rumen-protected form to be efficacious when administered orally.66 Early studies feeding increasing amounts of rumen-protected choline (regimens ranged from 0 to 20 g choline/day) showed modest to no impact of choline on energy balance and liver triglyceride measures.67,68 In a controlled fatty liver induction study, feeding 15 g choline/day during the induction phase reduced blood NEFA and liver triglyceride.69 Feeding 15 g choline/day after induction of fatty liver tended to increase liver triglyceride clearance. Liver triglyceride was reduced and glycogen content increased when choline was fed at 25 g/day in the prepartal period (21 days) and at 50 g/day after parturition (60 days).70 Other recent preliminary studies found no response to choline supplementation, possibly attributable to lower BCSs and a lesser risk for negative energy balance.71,72
Supplying glucogenic substrates, such as glycol, propionate, or propylene glycol, immediately before or after parturition has been advocated as a preventive for negative energy balance disease problems.37,73–75 Prepartal fat supplementation also has been advocated to improve transition energy balance,76 but drenching fat did not show a positive response.77 Administration of 1 L of propylene glycol or glycerol per day as a drench for 10 days resulted in reduced blood NEFA and BHB concentrations. Shorter-term drenching protocols (3 days after calving) did not decrease BHB concentrations.74,75,77 In view of the labor-intensive nature of daily drenching, oral glucogenic precursor supplementation has been investigated. Oral drenching or bolus treatment (1 L or 1 kg/day) of propylene glycol78 or glycerol79 was more effective in reducing blood NEFA concentration, a result of increased insulin secretion, than was feeding the glucogenic precursor incorporated into a total mixed ration (TMR). Feeding 250 g of dry propylene glycol (60%) per day for 3 weeks after calving tended to reduce blood BHB but not NEFA concentrations.80 In this study, the response to propylene glycol in the TMR may have been confounded by the greater DM intake for this treatment group. DeFrain and associates81 fed 1 kg glycerol in a TMR and observed a decline in DM intake; nevertheless, a modest effect on postpartum NEFA concentration was noted. Metabolic response to dietary incorporation of glucogenic precursors is promising relative to a practical control of ketosis.
Canadian research has shown supplementation of a controlled-release monensin capsule 21 days ante partum to be effective in reducing diseases associated with negative energy balance and improving cow health and production.82–85 Most recently, monensin sodium (Rumensin, Elanco) has been approved in the United States as a feed additive for lactating dairy cows. Although monensin was approved as a feed additive to improve feed-to-milk efficiency, its effect on rumen microbial fermentation to increase propionate production may help stabilize glucose homeostasis in transition cows and be beneficial in preventing ketosis.86 In agreement with studies using the controlled release capsule, daily prepartal monensin supplementation has been shown to reduce blood NEFA and BHB concentrations and to improve glucose kinetics and consequently has potential for ketosis prevention.87–89
In addition to implementing various targeted dietary and management preventive strategies, application of a herd ketosis monitoring program (refer to “Herd Diagnostics” section earlier) is warranted and cost effective.23,29,90,91 Monitoring prepartal NEFA concentration will highlight risk potential for fatty liver, ketosis, and other periparturient diseases. Monitoring postpartum BHB concentration will more specifically target subclinical or clinical ketosis risk, as well as related risk for left displacement of the abomasum (LDA).23,92,93
DISTURBANCES OF MACROMINERAL HOMEOSTASIS
Hypocalcemia
Parturient hypocalcemia (milk fever, parturient paresis) is an acute Ca deficiency condition that manifests with progressive loss of skeletal, cardiac, and smooth muscle function. The disease most commonly occurs in high-producing adult cattle within 48 hours of calving, although a small percentage of cases occur ante partum and between 48 and 72 hours after calving. It is the most common metabolic disease of dairy cattle but also occurs in beef cattle infrequently. Parturient hypocalcemia is problematic as a result of its association with eight other periparturient disease processes and its negative effect on postpartum DM intake.94 Costs associated with a clinical hypocalcemic event were estimated at $334 per case. Overall incidence of clinical hypocalcemia is approximated at 8% to 9%,95 but variation between herds is tremendous, ranging from none to greater than 60% prevalence.96
Subclinical hypocalcemia is defined as total serum Ca concentration below 8.0 mg/dl in the absence of clinical signs of hypocalcemia.97 Cows with subclinical hypocalcemia are thought to be predisposed to lower intake and other secondary diseases, including LDA.98 Cows with subclinical hypocalcemia had higher NEFA concentrations compared with normocalcemic cows.97 Cows experiencing one or more postpartum disease events had lower total Ca concentrations in the prepartal period (8.1 versus 8.5 mg/dl) and post partum (8.1 versus 8.9 mg/dl) compared with healthy cows.99 When total serum Ca concentration before or after calving was below 8.0 mg/dl, cows were 1.6 times more likely to experience postpartum disease.99 Using samples collected during the 2002 National Animal Health Monitoring dairy study, subclinical hypocalcemia was found in 25.3%, 43.9%, and 57.8% of samples collected (within 48 hours of calving) from first, second, and third- (and greater) lactation cows, respectively.97
Pathophysiology
In calcium homeostasis and mechanisms inducing hypocalcemia, the underlying pathogenesis has been related to a failure of the Ca homeostatic system to maintain blood Ca2+ concentrations with the onset of lacta tion.100 Parathormone (PTH)—which responds to low blood Ca—and calcitonin (CT)—which responds to high blood Ca—are counterregulatory hormones precisely controlling blood Ca concentration within a narrow physiologic range. PTH, through its action on the kidney, hydroxylates circulating 25-hydroxycholecalciferol to 1,25-dihydroxycholecalciferol (1,25-DHCC), the biologically active form of vitamin D. Kidney, intestine, and bone—primary target organs for PTH and 1,25-DHCC to increase Ca entry into the plasma pool—appear to be unresponsive to calcitropic stimulation. The acute loss of Ca in colostrum and milk at calving is not ameliorated by influx from intestine or bone, and hypocalcemia develops. Pool size of labile bone Ca, as well as number of vitamin D receptors, decreases with age, accounting for observed greater hypocalcemia prevalence in older cows.101 Similarly, Jersey cattle have fewer vitamin D receptors compared with Holstein cows,102 possibly accounting for greater hypocalcemia prevalence in Jersey cattle.
Goff103 has reviewed specific factors that have been implicated in altering target organ response leading to hypocalcemia. Beyond age effects on receptor numbers, responsiveness of target organs can be suppressed by hypomagnesemia, hyperphosphatemia, and acid-base status resultant from dietary alterations. Hypomagnesemia impairs release of PTH and the interaction between PTH and its target organ receptor. Hyperphosphatemia interferes with activation of vitamin D by inhibiting activity of renal 1-hydroxylase enzyme. Dietary cation-anion difference (DCAD), as defined by the formula (Na + K) − (Cl + S), influences blood acid-base status and ultimately Ca homeostasis. Feeding a diet relatively higher in cations than in anions induces a metabolic alkalizing effect that is believed to blunt target tissue response to PTH stimulation. Acidification, achieved by feeding a diet relatively higher in anions than in cations, induces a release of bone mineral, primarily Ca, in an effort to support blood buffering systems. This released bone Ca is lost through the kidneys but can be reabsorbed under appropriate stimulation during a hypocalcemic episode. Forage-based diets often are high in K content and greatly contribute to excessively high-DCAD dietary conditions. Sodium-based feed supplements, namely, calcium bicarbonate, also can contribute to excessive cation intake and initiate an alkalizing situation leading to dysregulation of Ca homeostasis.
Clinical Signs
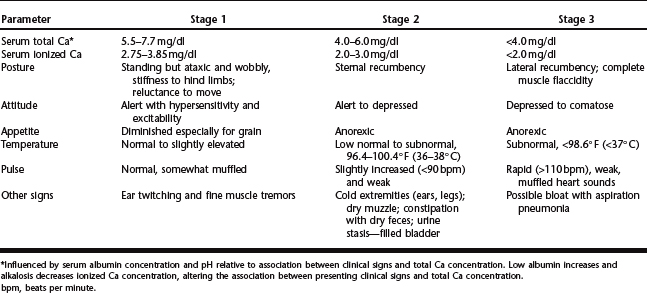
Clinical signs associated with parturient hypocalcemia occur as a spectrum of progressive muscular weakness. Progression of clinical signs often is characterized into three clinical stages based on serum concentration of ionized Ca2+ (Table 46-2).96,104 Association between ionized Ca and muscle function is a result of the multiple roles Ca plays in nerve conduction, neuromuscular stimulation and muscle fibril contractility.96,104 Mild hypocalcemia results in destabilization of peripheral nerve membranes, which may account for observed hyperexcitability and fine muscle tremors. Ca facilitates movement of actin and myosin fibers during contractility and release of acetylcholine at the myoneural junction. Progressive hypocalcemia could result in decreased acetylcholine release and muscle contractility, accounting for the ensuing flaccid paralysis observed in more severe cases.
Diagnosis
Determination of low plasma or serum Ca concentration is diagnostic. Practical ability to timely measure blood Ca concentration before treatment is limited, however. History and presenting clinical signs, in conjunction with rapid response to Ca therapy, are more typically used in diagnosis.96 Collection of a blood sample before therapy is encouraged because this sample can be analyzed later if response to therapy is unfavorable. In addition to hypocalcemia, clinical chemistry abnormalities observed in uncomplicated cases include hypophosphatemia (<3 mg/dl), hypermagnesemia (>3 mg/dl), and hyperglycemia (>100 mg/dl). Elevated PTH concentrations associated with hypocalcemia may account for observed hypophosphatemia, due to increased renal excretion, and hypermagnesemia, a result of increased renal reabsorption.103 Elevated cortisol levels associated with parturition and other stress factors could account for observed hypoglycemia. Depending on duration and bedding conditions of a recumbent hypocalcemic cow, muscle enzymes, creatine kinase (CK), and aspartate transferase (AST) may be elevated. Other concurrent conditions, especially hepatic lipidosis, could alter blood specific liver function and energy balance analytes accordingly.
A thorough physical examination is critical in evaluating a recumbent cow. Many other disease conditions can mimic hypocalcemia or complicate cases. Considerations in the differential diagnosis include musculo-skeletal (fractures, luxations, compartmental crush syndrome) and neurologic (nerve paralysis, calving paralysis) injuries, acute toxic infections (mastitis, metritis, peritonitis), metabolic derangements (hypomagnesemia, hypokalemia, ketosis/hepatic lipidosis), and hemorrhage.96,104
Treatment
Without appropriate timely treatment, hypocalcemia can be fatal in approximately 60% to 70% of cases. Notwithstanding, 6% of affected cows die during treatment. Therapy is directed at replacing and maintaining serum Ca concentration. Calcium solutions are cardiotoxic, so careful intravenous administration relative to rate and dosage is important. Calcium solutions should be administered intravenously to effect, while monitoring heart rate and rhythm and clinical response. As a general rule, Ca solutions should be dosed slightly less than 2 g Ca per 100 kg (220 lb) of body weight and at a rate of 1 g Ca per minute.105 Underdosing is not effective and results in more relapses and increased risk for injuries from struggling to rise. Hypercalcemia is a concern not only from potential cardiotoxicity but for its suppressive effect on PTH release and delay in maintaining Ca homeostasis.105
Although cows may show favorable response to intravenous therapy, 25% to 30% of cases relapse within 24 to 48 hours.104 Some cows may have a delayed response to vitamin D activation, resulting in cyclic relapses.106 Other cows, as a result of high milk production, are unable to maintain Ca homeostasis. Calcium solutions can be administered subcutaneously, but the time required for correction from hyper- to normocalcemia is 4 to 5 hours, similar to that with intravenous therapy.105 Less severe hypercalcemia after subcutaneous administration is observed. Subcutaneous administration can be associated with local injection site reactions as a result of Ca-induced cellular necrosis. Solutions containing dextrose also can be injurious as a result of their high osmolarity. To limit potential injection site lesions, solutions without dextrose should be used, and the volume limited to 50 or 75 ml (1 to 1.5 g Ca) per site.105 The injection site is massaged to help distribute the bolus injected. Response to subcutaneous Ca administration is dependent on peripheral perfusion; even so, it is not as therapeutically effective as intravenous treatment. Caution is warranted before administering intravenous treatment to a cow that has been repeatedly treated subcutaneously without success, because the risk of cardiotoxicity from the combined doses is more likely.96,105
Oral supplementation of highly soluble Ca salts can augment parenteral therapy to treat mild hypocalcemia or minimize relapses.107,108 Passive diffusion of ionized Ca across cellular tight junctions can occur when Ca concentration is sufficiently high.105 A dosage of at least 50 to 75 g Ca is needed to drive the passive absorption process. Calcium chloride (CaCl2) (36% Ca) often is used but is irritating and can induce metabolic acidosis. Physical injuries to the pharyngeal area can occur with use of tubed gel products, as well as chemical injury when gel tubes contain CaCl2. Aspiration pneumonia can occur when the solution is provided as a drench. Calcium propionate (21.5% Ca) can be used similarly to CaCl2 as an oral supplement. Use of calcium propionate may be preferred because it is less irritating, does not induce metabolic acidosis, and provides propionate as a glucose precursor. Supplying 250 or 350 g calcium propionate provides approximately 54 or 75 g Ca, respectively. Oral Ca supplementation can maintain elevated blood Ca concentration for 5 to 7 hours. Besides amount of Ca supplied, form (gel, slurry, drench) and volume will influence degree of passive Ca absorption and response.105,108,109 Oral and subcutaneous Ca administration should be used prophylactically, in early stages, or for relapsing cases. Recumbent cows should receive appropriate intravenous therapy. Caution is advised in combining therapies, because the potential for cardiotoxicity is increased and stabilization of Ca homeostasis is delayed. Prevention of hypocalcemia is discussed later under “Maintaining Calcium Homeostasis.”
Hypophosphatemia
Phosphorus (P), as the phosphate anion (PO42−), plays important biologic roles in skeletal mineral content, blood and rumen acid-base status, cellular energy transfer, metabolic reactions, and phosphorylated molecules (phospholipids, nucleic acids, phosphoproteins). Homeostatic regulation of blood P mimics that of Ca, sharing the same regulators PTH, CT, and 1,25-DHCC. Unique to P regulation is salivary recycling in support of rumen microbes, which accounts for 30 to 90 g P lost per day, or nearly 10 times the total extracellular P pool.103
Profound dietary P deficiency will lead to altered bone mineralization, resulting in rickets or osteomalacia in young and growing or aged animals, respectively. Hypophosphatemia sometimes is associated with postparturient hemoglobinuria, a condition characterized by red blood cell membrane fragility and lysis with release of hemoglobin pigment into blood and urine. P deficiency is thought to impair red blood cell energy production via glycolysis, thereby impeding the red blood cell’s deformability as it passes through small-diameter capillaries.110 Acute profound hypophosphatemia (<1 mg/dl) has been observed in late-pregnancy beef cattle and early-lactation dairy cows. Affected cows typically present with hindlimb weakness, inability to rise, bright alert attitude, and willingness to eat; such animals often are referred to as “alert downer cows” or “creeper cows.” Increased P losses to fetal development or colostrum and milk production can precipitate acute hypophosphatemia, especially if the diet is marginal in P, although these situations often are further complicated by concurrent hypocalcemia, hypomagnesemia, and hypoglycemia.103,111 In dairy cattle, acute hypophosphatemia occurs after calving, even with a P-adequate diet, and typically is associated with an unresponsive treatment for a hypocalcemic episode.
Hypophosphatemia (phosphate level of 1–2 mg/dl; normal range, 4–8 mg/dl) accompanies parturient hypocalcemia, but after appropriate Ca therapy, blood P concentration returns to normal. Increasing PTH in response to lower blood Ca concentration at parturition induces a decline in blood P concentration as a result of increased renal P clearance and salivary P recycling.103,111 Intestinal P absorptive efficiency is influenced by 1,25-DHCC; however, a portion of recycled P is inherently lost in feces, resulting in a net loss of exchangeable pool P. In a small number of cows, recovery of blood P concentration after Ca therapy fails, culminating in a hypophosphatemic downer cow. The mechanism responsible for this lack of response has not been elucidated. Reduced rumen motility might impair recycled salivary P absorption.103 Metzner and Klee observed low blood P concentrations in downer cows who failed to ruminate; however, hypophosphatemia was not considered a significant contributor to recumbency in their downer cow survey.112
Recumbent cows with hypophosphatemia (<2 mg/dl) can be treated with P supplements given intravenously, orally, or both. The chemical form of P has been shown to be important for biologic utilization and effective therapy where only the phosphate anion is biologically available. Derivatives of phosphinic acid (hypophosphite [PO23−], phosphite [PO33−]) are not biologically available.113 Phosphite salts are more water soluble and do not precipitate in the presence of Ca or Mg, thus allowing their common use in commercial multiple electrolyte solutions. For intravenous treatment, 6 to 7 g P is the desired total dosage, which can be supplied by 23 to 30 g monosodium phosphate or one sodium phosphate–based human enema product (Fleet Enema).105,113 The mineral source should be diluted in 1 L saline and the enema in 1 L water to reduce adverse effects from pH and tonicity, respectively. Calcium solutions should not be added to either of these preparations because they will induce precipitation of calcium phosphate. A more sustained blood P concentration with lower peak concentration after therapy is achieved with oral monosodium phosphate supplementation. A dose of 50 to 60 g P from 200 to 300 g monosodium phosphate (25% P) mineral is desired.105 The mineral can be suspended in water and administered as a drench, or preferably through a stomach tube. Gelatin boluses or gels containing the appropriate amount of phosphate source also are therapeutic. Other phosphate mineral sources (dicalcium phosphate, bone meal) are not soluble and will not evoke a change in blood P as rapidly. Intravenous phosphate supplementation will maintain blood concentrations for only a couple of hours, compared with longer than 6 hours with oral supplementation.105,113 With the mechanism responsible for inhibiting P recovery after hypocalcemia uncertain, the best method of preventing hypophosphatemia is to minimize risk of parturient hypocalcemia (see “Maintaining Calcium Homeostasis” section).
Stay updated, free articles. Join our Telegram channel

Full access? Get Clinical Tree


