Fig. 1
Representative T1-weighted MR serial images showing the abdominal aorta (white arrow) above the right renal artery of an apoE-KO mouse demonstrating large atherosclerotic lesions protruding the arterial lumen. Magnification of the aorta outlining the plaque area is displayed at the bottom right of each image
8.
A saturation pulse can be planned to eliminate signals from fat tissue to better delineate the outer boundary of the aortic wall and minimize chemical shift artifacts [11].
3.3 Image Analysis
We recommend to convert images to a standard format such as DICOM. Open source DICOM viewer software packages are available for Apple Macintosh computers (e.g., OsiriX, http://www.osirix-viewer.com), for Windows-based computers (e.g., Sante DICOM viewer, http://www.santesoft.com/dicom_viewer.html; Onis Free Edition, http://www.onis-viewer.com), as well as multiplatform software (e.g., 3D Slicer, http://www.slicer.org; Mango viewers, http://ric.uthscsa.edu/mango). Some of these software packages also provide initial and advanced imaging analysis. Some of the following measurements are commonly obtained after image magnification during the off-line analysis: vessel area, wall thickness, lumen area, and area of the plaque.
3.4 Validation of Results with Histology
Postmortem histological validation of the results obtained with noninvasive MRI is strongly recommended.
1.
After the last imaging session, euthanize the animal following the procedures approved by the ethics committee (see Note 13 ).
2.
Open the chest and cannulate the aorta via the left ventricle.
3.
Perfuse the aorta with PBS through an incision in the iliac arteries until complete exsanguination. Continue the perfusion with 5–10 ml of 10 % buffered formalin.
4.
Surgically remove the aorta and fix it in 10 % buffered formalin for 24 h. Aortic tissue segments can be embedded in paraffin or frozen using O.C.T. compound.
5.
Cut 5–10-μm-thick sections using a microtome (paraffin-embedded tissue) or a cryostat (O.C.T.-embedded tissue), and place them onto histology glass slides.
6.
Stain the sections with hematoxylin and eosin (H&E) for histopathological examination (see Note 14 ). Figure 2 shows an example of an abdominal aortic section stained with H&E demonstrating plaque formation.
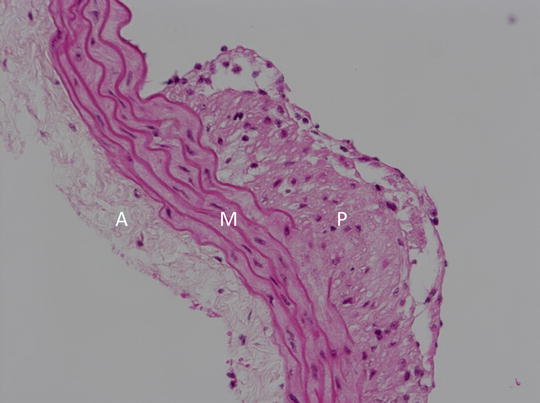
Fig. 2
Representative histological image (200×) of an aortic section from an apoE-KO mouse stained with hematoxylin and eosin (H&E). A adventitia, M media, P plaque
7.
Acquire photomicrographs with a camera attached to the microscope and perform morphometric measurements using dedicated software.
4 Notes
1.
Care of animals should be in accordance with institutional guidelines and regulations, and animal procedures must obtain approval from the Ethics Committee.
2.
Mouse models of atherosclerosis are based on genetic modifications of lipoprotein metabolism in combination with high-fat dietary changes [16]. Apolipoprotein E-deficient mice (apoE-KO) and low-density lipoprotein receptor-deficient mice (LDLR-KO) are the most commonly used models. We typically use apoE-KO mice and wild-type controls (both C57BL/6J, Charles River, Lyon, France).
3.


High-cholesterol and high-fat diet is required to accelerate the formation of atherosclerotic plaque. We use 0.75 % cholesterol and 11 % fat diet (S9167-E010, “Ssniff,” Germany), but other compositions with varying percentage of cholesterol/fat can be employed similarly.
Stay updated, free articles. Join our Telegram channel
Full access? Get Clinical Tree
