Fig. 1.
Mouse (left) and rat (right) MRI at 28 days following a moderate SCI. Images were taken using a T1-weighted protocol (a, b), a T1-weighted protocol with Gd contrast enhancement (c, d), or a T2-weighted protocol (e, f). SCI lesion (arrows) appears as a hypointense region in mice with T1 imaging, a combination of hypo- and hyperintense in rats, and a hyperintense region with Gd contrast in both species. With T2 imaging, the hyperintensity is less contained and demonstrates a larger lesion area in both rats and mice. Hyperintense regions are outlined with a solid line; hypointense regions are outlined with a dashed line. SC = Spinal cord. Scale bar = 0.45 cm for (a–d); 0.74 cm for (e); 0.4 cm for (f). © 2010 Wiley. Used with permission from Byrnes et al., Neuropathological differences between rats and mice after spinal cord injury, J Magn Reson Imaging, John Wiley & Sons.
Gonzalez-Lara et al. have also studied mouse SCI with MRI (20). Their approach was to use a lower magnetic field strength, clinical 3 T scanner, equipped with a high strength insertable gradient and an SNR efficient 3D imaging pulse sequence. Balanced steady state free precession (bSSFP) images showed a heterogeneous signal at the lesion epicenter with areas of both signal hyperintensity and signal hypointensity, representing the mixed pathology present in the injured cord. The areas of hyperintensity represented edema and acute hemorrhage and the regions of signal loss could be related to the accumulation of hemosiderin-laden macrophages, associated with hemorrhage breakdown (20). The 3D whole mouse body images presented in this paper also revealed the presence of large cystic lesions rostral to the epicenter of the SCI, at a distance much farther than would typically be interrogated by histology (20). These cysts resembled what has been described in the literature as posttraumatic syringomyelia (21), a relatively rare complication secondary to SCI which is not fully understood.
Another study has shown that high-resolution MRI of rat SCI can be performed on a clinical system. Sandner et al. demonstrated that hemorrhage, edema, and cyst formation could be visualized at 3 T in rats with contusion SCI (22). The authors discuss the advantages of using a clinical scanner, including: bore size, which allowed for imaging of older, larger rats; decreased mortality, since it allows for better ventilation; and scanner availability. This study was followed up by a comprehensive description of optimization methods to study CNS pathologies, including SCI, in rat models at 3 T, where the authors emphasized that lack of access to a dedicated high-field scanner should not be a limitation to perform small-animal MRI (23).
3 Magnetization Transfer Imaging
Magnetization transfer imaging (MTI) is based on the magnetization interaction between bulk water protons and macromolecular protons, such as proteins (24). MT contrast is generated by applying off-resonance RF irradiation designed to preferentially saturate the immobile, or bound, protons of macromolecules. This saturates the energy level of the bound protons, inducing energy transfer to the mobile, or free water, protons and consequently reducing their signal intensity (25). Thus, MTI indirectly measures the interaction between these two proton pools. The relative difference in signal intensity (SI) with and without magnetization transfer can be measured as the magnetization transfer ratio (MTR). The MTR has been very useful for assessing tissue pathology and most MTI has focused on intrinsic markers like myelin and collagen (26, 27). Much of the work evaluating the utility of the MTR as a marker of disease has focused on multiple sclerosis (MS) and the associated demyelination (28, 29). Demyelination results in a reduction in the MTR, as protons associated with macromolecules are lost. Several papers show a strong correlation between the MTR and myelin content (28–30). Schmierer et al. proved that the MTR is affected by myelin content in MS WM by measuring the MTR in fresh postmortem brains from MS patients (29).
The MTR has not been widely applied to study SCI. Franconi et al. measured the MTR of the cervical cord in a rat SCI model at 7 T and found the MTR to be most useful in defining the thin CSF surrounding the cord but less effective for distinguishing between WM and GM (31). McGowan et al. used MTI at 1.7 T for histogram analysis in a rat weight-drop injury model and showed that the WM MTR was predictive of myelination status and neurofilament damage (32). Gareau et al. used MTI to compare severe and mild SCI due to contusion in rats and showed that the WM MTR was lower for severe SCI on the first day postsurgery, but not by 1 week, and that the WM MTR was insensitive to differences between mild SCI and the control uninjured spinal cord (33). When using the MTR to evaluate SCI, or other CNS damage, it is important to consider the extent of other pathology in the tissue since the MTR can also be influenced by edema; the accumulation of fluid (and so more free water protons) in tissue will also lower the MTR (33).
4 Functional MRI
4.1 fMRI
Functional MRI (fMRI) is a specialized MRI technique used to measure the hemodynamic response related to neural activity in the brain or spinal cord (34, 35). When a neuron fires, it takes up large amounts of oxygen from hemoglobin molecules. The local response to energy utilization, which occurs with neural activity, is to increase blood flow to the region. Changes in the local concentration of oxyhemoglobin are detectable by MRI through paramagnetic effects. Blood-oxygen-level-dependent (BOLD) imaging is the fMRI method used to visualize where in the brain or spinal cord oxygen is being consumed, thereby mapping neural activation (34, 36). T2*-weighted images are acquired which take advantage of the fact that deoxygenated hemoglobin is magnetic whereas oxygenated hemoglobin is not. BOLD fMRI is a relative technique; images taken during one state are compared to another. Paradigms therefore have periods of rest alternating with periods of activation or task. An area is more “activated” when it has more oxygenated blood compared to another point in time.
One limitation of fMRI is that it is extremely sensitive to motion. In rodents this is dealt with through the use of anesthesia; however, the anesthetic agent and dosage can have a direct effect on the baseline BOLD signal (37, 38). Some cause vasodilatation in the cerebral vasculature, which results in uncoupling between flow and neuronal activation (39). Proper choice of anesthetic and dosage is crucial for the success of BOLD fMRI small-animal experiments. A number of papers describe the proper use of anesthesia for fMRI (40–42). BOLD fMRI is also limited in that artifacts are often present in regions that are close to air (i.e., sinuses). Another problem is that areas of activation may be observed in large draining veins rather than directly at a capillary bed near the site of neuronal activation.
BOLD fMRI works best at ultrahigh magnetic field strengths. This is because the volume of the smallest voxel affects the likelihood of distinguishing activity from distinct functional units, and the ability to segregate microvasculature signals in the gray matter from nonspecific contributions originating from large veins. Furthermore, high spatial resolution (small voxels) is constrained by the SNR and contrast-to-noise ratio (CNR) and ultrahigh fields provide an advantage because of field-dependent gains in SNR and CNR.
fMRI was initially developed to study the human brain and there have been significant challenges associated with implementing fMRI to study the spinal cord in both humans and small animals (43). Porszasz et al. were the first to perform fMRI in the rat spinal cord (44). Malisza and Stroman further refined the technique acquiring images of the normal rat cord at 9.4 T in response to painful stimulation applied to the dorsal forepaw. Activation was observed in regions of the spinal cord associated with motor and pain responses demonstrating the utility of fMRI as a tool to study animal models of pain and cord injury (45).
BOLD fMRI has been proposed as a method to monitor functional reorganization in the CNS after injury. Ramu et al. used fMRI to study brain reorganization in SCI rats at 4 and 8 weeks post-injury (46). To do this, electrical stimulation of the rat paws was performed while imaging the brain. In normal rats this resulted in brain activation confined to the contralateral somatosensory cortex. In rat SCI activation was widespread indicating extensive and ongoing neural brain reorganization. To study plastic changes in the spinal cord in response to injury, Endo et al. applied fMRI in rats subjected to complete transection of the mid-thoracic cord along with electrical hind limb stimulation (47). Stimulation, at levels that did not show activation in the normal rat spinal cord, resulted in BOLD contrast in the ipsilateral dorsal horn of the injured spinal cord at multiple time points, from 1 day to 6 months after SCI. These results suggest exaggerated responsiveness of spinal neurons after SCI, a condition that might be associated with mechanisms causing neuropathic pain and autonomic dysreflexia.
4.2 Perfusion Imaging
Perfusion MRI measures regional blood flow. Two perfusion MRI methods have been developed, initially for measuring cerebral blood flow. The first method, called bolus tracking, involves an i.v. injection of a gadolinium-containing contrast agent and measurement of the T2*-weighted signal as it perfuses through the tissue brain over a short period of time (48). Changes in blood flow over time after a single injection can be measured to generate a perfusion map. The second method is known as arterial spin labeling (ASL). In ASL blood flowing into the image slices of interest is magnetically “labeled” or “tagged” using radiofrequency pulses (49). A perfusion-weighted image can be generated by the subtraction of an image in which inflowing spins have been “labeled” from an image in which spin labeling has not been performed. Quantitative perfusion maps can be calculated if the tissue T1 and the efficiency of spin labeling are also measured. This method takes advantage of arterial water as a freely diffusible tracer; contrast agents are not required. The drawbacks of this technique relate mainly to its weak SNR and the sensitivity to motion as a source of error. ASL methods benefit from high magnetic field strengths because not only is the sensitivity higher, but T1 also lengthens, allowing more label to accumulate.
Perfusion refers to the delivery of oxygen and nutrients to tissues by means of blood flow, and is one of the most fundamental physiological parameters. In SCI perfusion can be severely compromised. Duhamel et al. have explored the use of ASL for measuring spinal cord blood flow (SCBF) in mice (50, 51). Absolute SCBF measurements obtained at the cervical (C3) and lumbar (L1) levels of the normal mouse cord showed significantly lower GM perfusion at L1 compared to C3. The technique was also successfully applied to a mouse model of hemisection performed at L1 to characterize the pathology.
4.3 Diffusion Imaging
Diffusion-weighted imaging (DWI) is very sensitive to the random movement of protons in water molecules (Brownian movement) (52). In DWI each image voxel has a signal that reflects the rate of water diffusion at that location. The amount of water diffusion for a given voxel can be calculated and is called the apparent diffusion coefficient (ADC) (53). Areas with low ADC values (i.e., low diffusion) appear more intense. ADC values are direction sensitive. For instance, if images are taken perpendicular to myelin fiber tracts (i.e., corpus callosum), ADC values will be lower than if the images are taken along the length of these fibers. Diffusion tensor imaging (DTI) is a quantitative imaging technique used to measure the amount of diffusion as a function of direction. Typically a full diffusion tensor analysis requires the acquisition of diffusion-weighted images along at least six independent directions of diffusion-sensitizing gradients. Therefore, DTI measurements of the rodent CNS are time consuming. From the diffusion tensor, diffusion anisotropy measures such as the fractional anisotropy and the mean diffusivity can be computed. Because DTI can provide information about the location, orientation, and anisotropy of WM tracts, it has been applied widely to study the injured spinal cord in animal models (54–59).
Ellingson et al. used DTI to explore lesion growth and degeneration patterns from the acute through the chronic stages of rat SCI (54). Significant growth of the traumatic lesion was detected up to 15 weeks post-injury. The mean diffusivity was sensitive to overall spinal cord integrity, whereas fractional anisotropy showed specificity to sites of cavity formation. DTI has also been used to assess preservation of disrupted rubrospinal tract axons and changes in glial orientation in the GM (55) and microstructural WM changes (56). In mouse SCI models, DTI has been used to study the evolution of ventrolateral WM changes following contusive SCI at 1, 3, 7, and 14 days post-injury. Measurements of directional diffusivity derived from DTI clearly showed rostral–caudal asymmetry of the injury and a trend of acute primary axonal injury followed by delayed, subacute myelin damage at the impact site (Fig. 2) (57). Sundberg et al. used high-resolution anatomical MRI and DTI at 7 T to study WM integrity following mouse SCI for 2 months post-injury (58). WM in regions up to 1 cm away from the injury epicenter appeared normal on anatomical MRI but exhibited significant changes by DTI. Histology confirmed a significant decrease in myelin and oligodendrocytes, suggesting that DTI is a more sensitive measure of the evolving injury in mouse SCI.
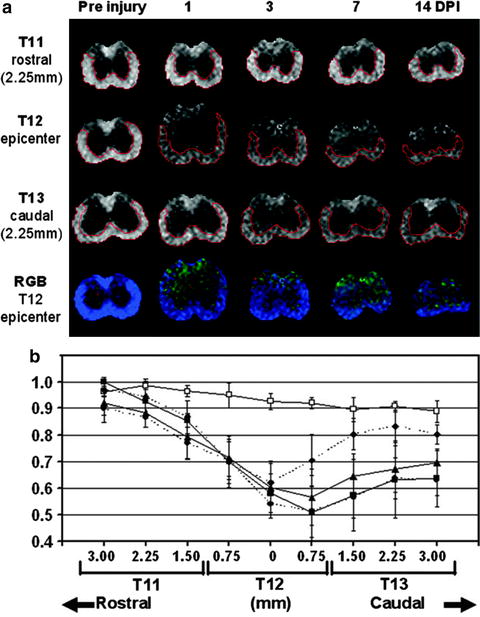
Fig. 2.
Representative pre- and post-injury RA maps (scale = 0–1.414) at the impact site (T12), 2.25 mm rostral (T11), and 2.25 mm caudal (T13) to the impact site demonstrate the temporal and spatial evolution of acute SCI (a). At the impact site (T12), a red–green–blue (RGB) color-coded anisotropy map (red = x, green = y, and blue = z) is shown in (a), with homogeneous blue color suggesting the consistent orientation of the ventrolateral WM tracts. The time course of RA derived using quantitative ROI analysis from ventrolateral WM at T11, T12, and T13 is shown in (b). GM/WM contrast attenuated over time but remained discernible within the impact epicenter at all measured time points. Rostrally, RA declined linearly as measurements approached the epicenter. At T11, ventrolateral WM appeared essentially normal at 14 DPI. In contrast, progressively diminishing RA was observed in ventrolateral WM at all measured levels caudal to the epicenter, primarily at 1–3 DPI. Ventrolateral WM ROIs are outlined in red. Open rectangle: pre-injury control; solid diamond: 1 DPI; solid triangle: 3 DPI; solid circle: 7 DPI; solid square: 14 DPI. © 2007 Wiley. Used with permission from Kim et al., Noninvasive diffusion tensor imaging of evolving white matter pathology in a mouse model of acute spinal cord injury, Magn Reson Med, John Wiley & Sons.
Tu et al. have reported that two-directional DWI provides similar diffusion measurements as full tensor DTI in normal and injured mouse spinal cord (59). Diffusion indices derived using two-direction DWI (parallel and perpendicular to axonal tracts) were compared with those obtained using six-direction DTI in a mouse contusion model of SCI and the measurements of the extent of spared WM after injury, estimated by either method, were in close agreement and correlated well with histology and behavioral tests.
5 Cellular MRI
Cellular MRI is a relatively young field of MRI research that combines the ability to obtain high-resolution image data with the use of magnetic contrast agents for labeling specific cells, thereby enhancing their detection (60). Superparamagnetic iron oxide (SPIO) nanoparticles represent a class of magnetic contrast agents used for cellular MRI that exhibit extremely high relaxivity (61). A variety of iron oxide-based labels are now available (62). Iron-labeled cells are usually imaged using either T2*-weighted GE or T2-weighted SE sequences (62). The presence of the magnetic label causes a distortion in the magnetic field and leads to abnormal signal hypointensities. Areas containing iron-labeled cells appear as regions of low signal intensity, creating negative contrast. The large magnetic susceptibility of these particles affects an area much larger than the actual particle size. This effect is known as a “blooming artifact,” and leads to an exaggeration of the region occupied by iron oxide (63).
Cellular MRI studies use one of two ways to label cells with iron particles, in situ or in vitro. In situ labeling is performed by injecting iron particles intravenously with the goal of labeling circulating immune cells or immune cells at the site of inflammatory lesions. This approach has been used to detect and monitor macrophages in many different preclinical disease models, including experimental autoimmune encephalomyelitis (EAE) (64, 65), ischemic stroke (66), atherosclerosis (67, 68), peripheral nervous system injury (69), arthritis (70), and rejection in a variety of transplantation models (71–73). To determine the contribution of blood-derived macrophages to the signal loss observed in MR images of inflammatory lesions after i.v. SPIO, Oweida et al. performed in situ cell labeling in a mouse model of MS using transgenic mice that expressed enhanced green fluorescent protein (EGFP) specifically in hematopoietic cells of the myelomonocytic lineage (64). MRI revealed the presence of discrete regions of signal loss throughout the brains of animals that were administered Feridex and histology showed that regions of signal loss on corresponded anatomically with regions of PPB- and GFP-positive cells. This experiment provided the first direct evidence that macrophages of hematogenous origin are labeled with SPIO after i.v. administration of SPIO, and contribute to the regions of signal loss detected in MR images (Fig. 3). Dunn et al. used cellular MRI to detect macrophages in a clip compression model of SCI in the rat ex vivo MRI at 1.5 T (74).
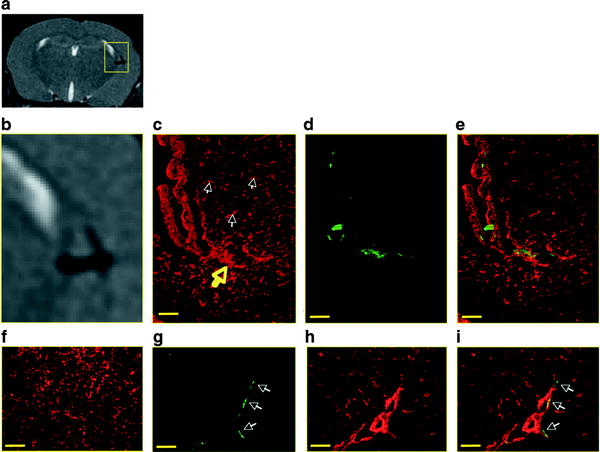
Fig. 3.
Correlation of signal loss on MR with macrophage- and GFP-positive histology. (a) An MR image shows a periventricular region of signal loss. An enlarged view of the region of signal loss is shown in (b). Corresponding histology sections show macrophage accumulation with F4/80 staining and (c) GFP expression with anti-GFP staining (d). White arrows point to microglia, and yellow arrow points to macrophage accumulation. An overlay image of (c) and (d) is shown in (e) demonstrating colocalization of stains. Ventricle region is indicated with letter V. Control sections from non-EAE animals injected with Feridex show microglia-positive staining (f) that does not correspond to GFP-positive regions. When GFP-positive regions are detected (g) they are within blood vessels, as evidenced by tomato lectin staining (h, i). Scale bar = 6 μm. © 2007 Wiley. Used with permission from Oweida et al., Iron-oxide labeling of hematogenous macrophages in a model of experimental autoimmune encephalomyelitis and the contribution to signal loss in fast imaging employing steady state acquisition (FIESTA) images, J Magn Reson Imaging, John Wiley & Sons.
In vitro cell labeling involves prelabeling cells prior to their injection or transplantation and following their fate with MRI. Many types of cells will readily take up iron particles by simple coincubation with iron oxide particles. For example, macrophages, cancer cells, and stem cells, are relatively easy to label this way. Other cells, in particular nonadherent cells, are more difficult to label and require specialized techniques. Various methods have been developed to enhance the amount of iron taken up by cells such as the use of transfection agents (75), functionalized iron particles (76), magnetoelectroporation (77–79), magnetic fields, and cell penetrating peptides (80). SPIO has been used to label and track a wide variety of cell types including T lymphoctyes (81), macrophages (82), pancreatic islets (83), cancer cells (63), and stem cells (84) with minimal impact on cell function over a period of several weeks and over multiple cell divisions.
Sykova et al. showed that iron-labeled mesenchymal stem cells (MSC) administered i.v. in SCI rats can be detected as regions of signal loss in ex vivo images of the cord at 4 weeks after the cell injection (84). They also showed that iron-positive cells in the cord did not colocalize with macrophage staining, suggesting that iron-labeled MSC persist and can be tracked with MRI. Dunning et al. have used SPIO to label and track Schwann cells (SC) and olfactory ensheathing cells (OEC) in vivo for up to 4 weeks in SCI rats. They showed by histology transplanted cells remyelinating the demyelinated axons, demonstrating that the iron-labeled cells retained their biological function and that the majority of the label had remained within the transplanted cells (85). Lee et al. tracked SPIO labeled OEC in rat SCI for 2 months and found that MRI was able to show that the OEC were unable to bridge the transection lesion (86). Gonzalez-Lara et al. were the first group to use cellular MRI to track transplanted stem cells in the injured mouse cord (20, 87). The presence of transplanted cells in the cord was easily visualized as a large localized region of signal loss and could be monitored over time in vivo (Fig. 4). MRI was also useful for evaluating the accuracy of the transplantation technique since iron-labeled cells inadvertently placed outside of the spinal cord tissue could be readily identified and these mice were removed from the longitudinal study. This short-term cell tracking is valuable because endpoint histological analyses of these transplantation studies normally report on the presence or absence of stem cells in the tissue, and knowledge of the success/failure of the original transplantation is crucial for the interpretation of these data.
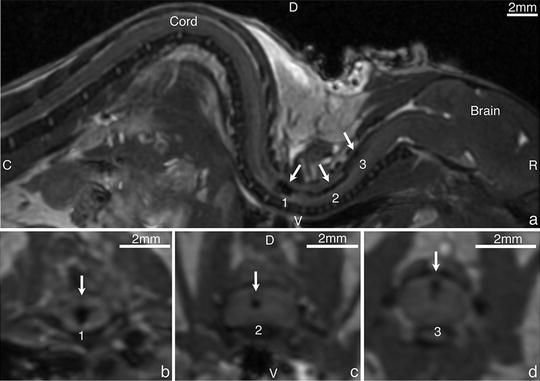
Fig. 4.
Representative sagittal image ((a), top) of a mouse that received a successful transplant of iron-labeled MSC and corresponding cord areas in an axial plane (bottom). Clear areas of signal loss were observed within the cord: 1: close to the central canal (b), 2: by the white dorsal column (c) and 3: closer to the CSF (d) D-dorsal, V-ventral, R-rostral, C-caudal. © Gonzalez-Lara, Laura E., “In Vivo Cellular MRI In Experimental Traumatic Spinal Cord Injury” (2011). Electronic Thesis and Dissertation Repository. Paper 238.
The biggest limitation of using iron nanoparticles and MRI for cell tracking in SCI models is that when iron-labeled cells die (or free iron is released) the iron may be taken up by bystander cells (macrophages), which will confuse the image interpretation (88–90). In any direct transplantation model a percentage of transplanted cells are expected to die due to the injection procedure itself (91). Cells labeled peripherally after i.v. SPIO administration, or the viable transplanted cells, will also eventually die at the SCI lesion site due to the harsh inflammatory conditions. This is compounded in SCI models by disrupted blood flow at the lesion site, which may result in an accumulation of iron particles due to cell death. Gonzalez-Lara et al. recently examined this issue in a longitudinal imaging study that followed SCI mice for 6 weeks after the direct transplantation of viable iron-labeled MSC, dead iron-labeled MSC, or free iron particles (87). The MRI appearance of the region of signal loss at the transplant site was similar for all three groups. In all transplanted SCI mice the volume of signal loss decreased over time. This decrease was most rapid in SCI mice that received live iron-labeled cells. The persistence of signal loss in the images of cords from mice that received dead MSC or free iron was attributed to iron particles lodged in the damaged cord tissue at 6 weeks postinjection, as shown by iron stained histology. The method of transplantation, host tissue, cell type, cell lifespan, and the extent of inflammation in the model system no doubt play important roles in the cell survival and clearance. The direct transplantation models for the injured spinal cord may represent the worst-case scenario for cell tracking with MRI. Long-term tracking of stem cells by MRI in models of SCI should be carefully validated through histology.
< div class='tao-gold-member'>
Only gold members can continue reading. Log In or Register to continue
Stay updated, free articles. Join our Telegram channel

Full access? Get Clinical Tree


