Fig. 1.
Laser Speckle Contrast Analysis Device (Moor Instruments). The laser is emitted through the rectangular window on the left. The lens on the right is part of the CCD camera. The two wheels on the top side allow manual adjustment of zoom and focus.
2.1.2 Tissue Penetration Depth
The penetration depth of the infrared laser depends on the optical properties of (a) the laser light and (b) the sampled tissue and is reported in the range of 500 μm to 1 mm (6, 9). In general, tissue perfusion and flow velocity in large vessels can be measured in exposed tissue such as the human brain, where the vasculature courses close to the surface (7). In the mouse, after retraction of the scalp cortical perfusion can be easily assessed through the intact scull without the need for drilling a cranial window (1).
2.1.3 Spatial and Temporal Resolution
The spatial and temporal resolution is inversely related and its selection is a compromise of acquiring sharp and detailed images with a sufficiently high sampling rate for dynamic real-time live imaging. For continuous high-resolution transcranial assesment of the cerebrovascular reactivity by acetazolamide challenge in mice (see chapter 2.1.4 and Fig. 2), we recommend a sampling rate between 1 and 0.25 Hz, depending on the duration of the entire measurement.
2.1.4 Real-Time Recording of CBF Flux
Laser speckle imaging delivers an immediate, noninvasive functional readout of relative cortical blood flow with direct assessment of tissue perfusion. In order to plot flux values over time in a graph or chart, regions of interest (ROI) ROIs with variable size and location can be positioned over the speckle images and the CBF-flux within that ROI is recorded for each image at the same sampling rate as the live image measurement. The flux value within this user-defined ROI is a calculated mean of the individual flux values within the region. The values are plotted and the resultant trace can be analyzed to compare flow changes before, during, and after an intervention. Figure 2a, b gives an example of in vivo LASCA images during cerebraovascular reactivity testing (Fig. 2a) and plotted CBF-flux (Fig. 2b) 6 h after experimental SAH in a C57/BL6 mouse.
Fig. 2.
(a) LASCA images before (left ) and after (right ) cerebrovascular reactivity testing through acetazolamide application in a C57/BL6 mouse 6 h after experimental SAH. The speckle contrast is displayed in a color-coded real-time matrix. Tissue perfusion in the arbitrary unit flux can be referenced to the legend on the right-hand side. The flux values are calculated in the left and right hemispheric ROI and plotted over time. (b) Real-time CBF-flux in two regions of interest. The straight and dashed line refer to the mean flux value within the rectangular left- and right-hemispheric ROIs before and after acetazolamide is given to increase cortical CBF. The CBF-flux values are plotted over time (x-axis).
2.2 Instruments and Materials for Surgical Preparation
2.2.1 Instruments
To surgically expose the scalp, the following instruments are recommended (Fig. 3):
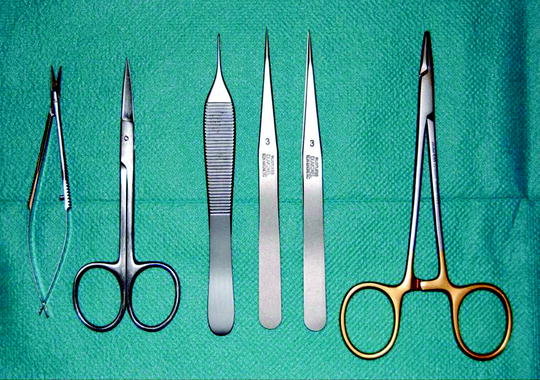
Fig. 3.
Surgical instruments required for tissue preparation. Left to right: microscissors, surgical scissors, anatomical and microsurgical forceps, and needle driver.
Small surgical scissors and microscissors
Forceps (anatomical and microsurgical)
Needle driver
Surgical microscope (optional)
Fur trimmer/razor
2.2.2 Materials
In addition, the following materials are required:


Portable surface/pad for mobile positioning of the mouse
Temperature-controlled heating pad
4× Silk sutures (6/0)
1× Nylon suture (6/0)
Cotton swabs< div class='tao-gold-member'>Only gold members can continue reading. Log In or Register to continue
Stay updated, free articles. Join our Telegram channel
Full access? Get Clinical Tree
