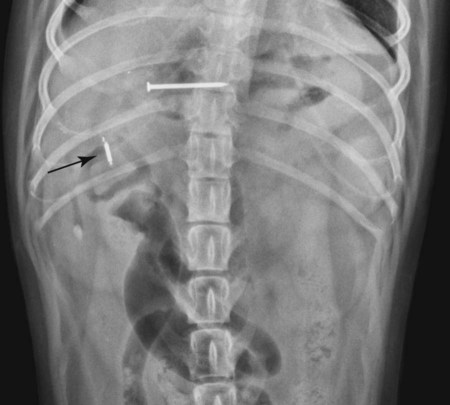
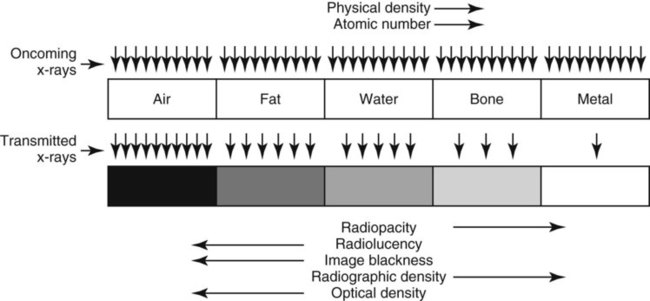
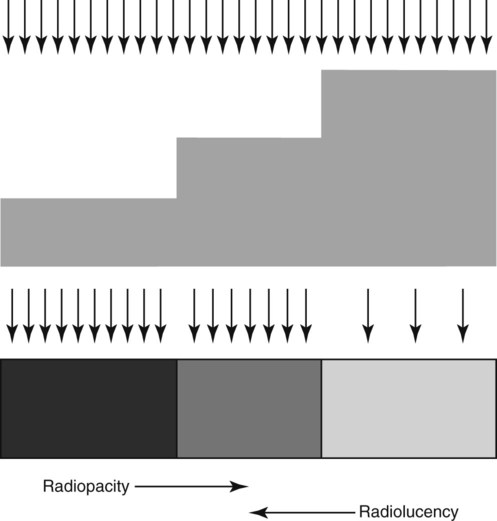
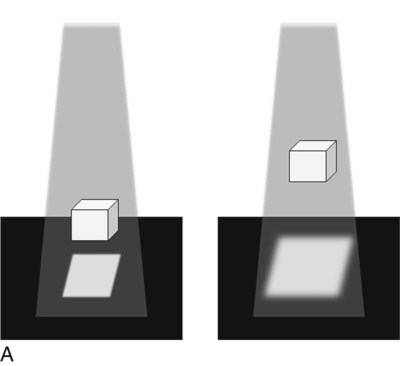
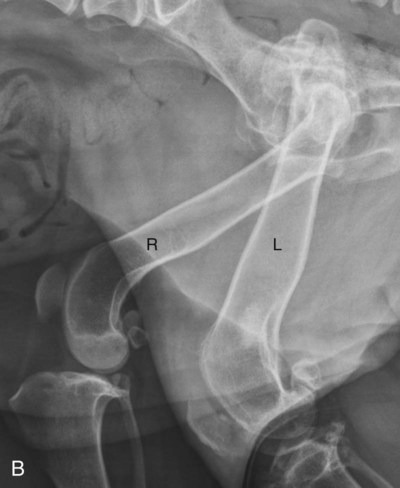
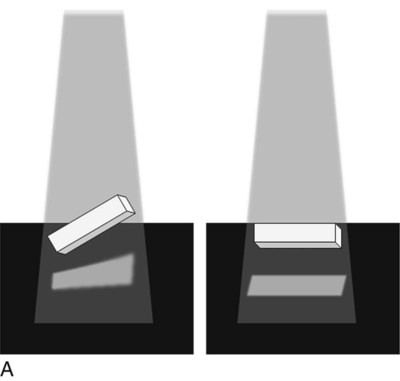
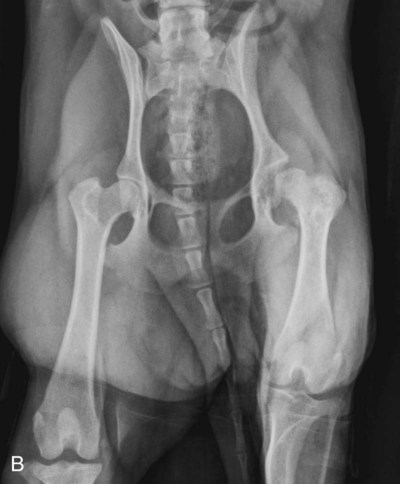
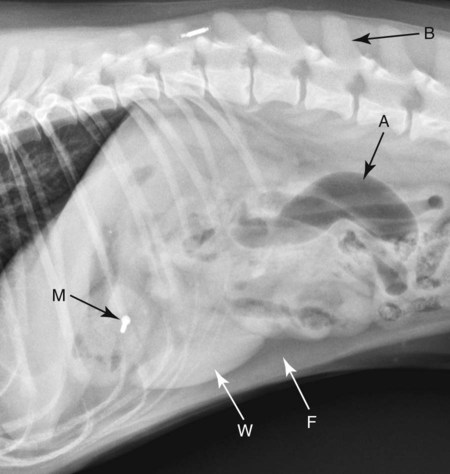
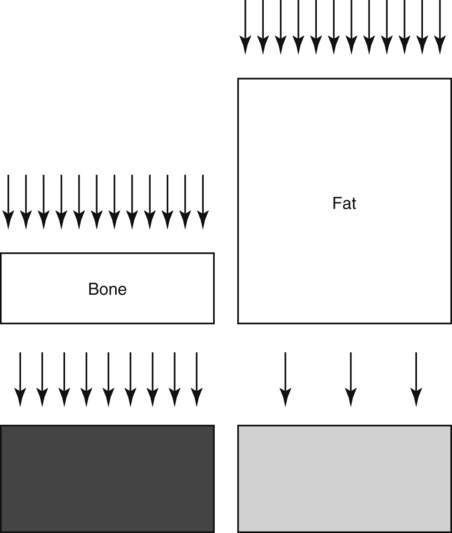
In analog radiography, image blackness depends on the amount of light emitted by the intensifying screen; this was discussed in Chapter 1. This light, which is related to the number of oncoming x-rays, is the major cause of film blackening. In digital radiography, image blackness is also dependent on the number of oncoming x-rays, but in digital radiography the x-rays interact with the imaging plate to produce the image. Digital imaging plates were described in Chapter 2. In digital radiography, computer manipulation of the image after it is produced is also a big factor that controls the amount of image blackness. The analog cassette that contains the film and intensifying screen and the digital imaging plate can each be referred to as a receiver. Regardless of the type of imaging system, the following generalizations apply. First, areas of the image that are black represent regions where many x-rays passed through the patient and struck the receiver. Second, areas of the image that are white represent regions where many x-rays were absorbed in the patient, and few or none struck the receiver. Between these two extremes of black and white are many gray image tones, the opacity of which is directly related to the number of x-rays that penetrate the patient and reach the receiver (Fig. 5-1). Of particular importance is the fact that x-rays are absorbed heterogeneously by the body, depending on the makeup of the tissue. This differential absorption is caused by the dependence of absorption on the effective atomic number and physical density of the body part, as also discussed in Chapter 1. If x-ray absorption was uniform, the resulting radiographic image would be homogeneously gray or white. If no absorption occurred, the resulting radiographic image would be homogeneously black. The effect of differential absorption is apparent in Figure 5-1, in which areas peripheral to the dog are black because no x-rays were absorbed before reaching the receiver. Soft tissues of the dog are visible because they have absorbed some x-rays from the primary beam. Bones of the dog are more radiopaque than soft tissues; the bones have absorbed more x-rays, and thus the part of the receiver under the bones was struck by fewer x-rays than areas adjacent to the bones. The nail and microchip are nearly totally radiopaque because essentially no x-rays were able to pass through them. The term density is used occasionally to describe the degree to which a patient or object absorbs incident x-rays. For example, in Figure 5-1, the nail and microchip could be described as being denser than adjacent soft tissue. Use of density in this context is confusing because the optical density* of the nail and microchip is low, whereas the radiographic density is high. Further confusion arises when the added variable of physical density (grams per cubic centimeter) of the patient or object is considered. As physical density increases, optical density decreases, and radiographic density increases. This confusing terminology can be eliminated completely by avoiding use of the term density to describe radiographic changes. The degree of blackness or whiteness of the patient should be referred to in terms of radiolucency or radiopacity (Fig. 5-2). For example, in Figure 5-1, soft tissues of the abdomen are less radiopaque than the bones; both are more radiolucent than the nail and microchip. It may also be said that the nail and microchip are more radiopaque than the remainder of the dog. The ability of a radiograph, whether analog or digital, to display subtle differences in x-ray absorption is limited. This concept, termed contrast resolution, is what allows adjacent structures to be discriminated from each other in the radiographic image. Unfortunately, the relatively poor contrast resolution of radiographs, compared to computed tomography or magnetic resonance imaging, means that many pathologic alterations will not be visible radiographically. The relatively poor contrast resolution of radiographs also means that the range of opacities visible radiographically can be described, in general terms, according to one of five radiographic terms—air (or gas) opacity, fat opacity, water (or soft tissue) opacity, bone (or mineral) opacity, and metal opacity. These five radiographic opacities are convenient because they are visually distinct and are created by tissues found commonly in patients being radiographed. Figure 5-3 is the lateral view of the dog in Figure 5-1; all five radiographic opacities are present (consult the figure legend). It is important to realize that a radiographic opacity is not specific for the tissue type of origin, but only to groups of substances that have similar attenuation properties (Table 5-1). Table • 5-1 Examples of Various Tissues and Substances According to the Radiographic Opacity Produced Thickness must also be considered in any discussion of relative inherent radiopacities because as thickness increases, radiopacity increases (Fig. 5-4). Thus the five basic inherent radiopacities (air, fat, soft tissue, bone, and metal) are relative, assuming that the object’s thickness is approximately the same. For example, although fat is inherently more radiolucent than bone, if a large thickness of fat is radiographed next to a small thickness of bone, the fat could appear to be more radiopaque (i.e., its total radiopacity would be greater) (Fig. 5-5). An extreme thickness difference that results in a reversal of inherent radiographic opacity is encountered rarely in real life and is used here only to emphasize the importance of thickness in the makeup of the visible radiographic opacity of an object or body part, along with physical density and atomic number. Magnification refers to the enlargement of a structure in the image relative to its actual size. Magnification depends mainly on the distance between the object and the receiver; as this distance increases, magnification increases. There will always be some parts of the patient that are farther from the receiver than others, thus some parts of every patient are magnified in the resultant radiograph. Magnification reduces detail because each bit of visual information is spread over a larger area of the image (Fig. 5-6). Based on the decreased detail that characterizes magnified parts, the area of primary interest should always be placed closest to the receiver to minimize the effect of magnification. The only exception to this guideline is in radiography of the small animal thorax in which lesions in the dependent lung are often not visible because the border of the lesion is effaced by the atelectatic dependent lung. In the lung, lesions in the nondependent lung are more conspicuous despite the effect of magnification; this is discussed in Chapter 25. The confounding effect of magnification is reduced as long as patients are positioned in a standard manner for radiography because any magnification that occurs just becomes part of the normal radiographic appearance. Distortion, however, is a more serious problem. Distortion is unequal magnification that occurs when the object and receiver planes are not parallel. Distortion leads to the image misrepresenting the true shape or position of the object. Just as with magnification, some distortion occurs in every radiograph because there are always some parts of the patient that are not parallel to the plane of the receiver. Distortion caused by deranged anatomy or nonstandard patient positioning, however, can limit the diagnostic quality of the radiograph (Fig. 5-7).
Introduction to Radiographic Interpretation
Image Formation and Differential Absorption
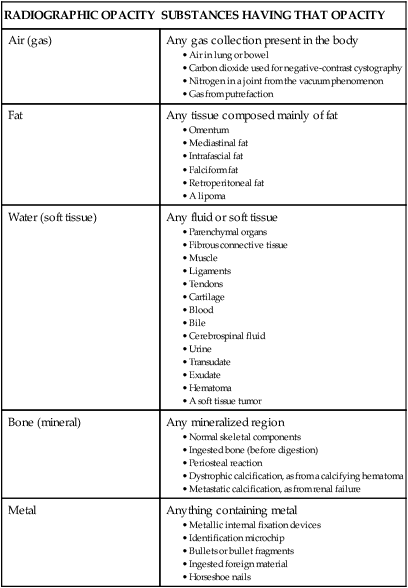
Radiographic Opacities
RADIOGRAPHIC OPACITY
SUBSTANCES HAVING THAT OPACITY
Air (gas)
Any gas collection present in the body
Fat
Any tissue composed mainly of fat
Water (soft tissue)
Any fluid or soft tissue
Bone (mineral)
Any mineralized region
Metal
Anything containing metal
Radiographic Geometry and Thinking in Three Dimensions
Magnification and Distortion
Introduction to Radiographic Interpretation