Fig. 1.
(a) T2*-weighted magnetic resonance (MR) images acquired with a gradient echo sequence (GRE) allow to visualize the experimental frontal hematoma in a pig. (b) Photograph displaying the experimental hematoma shown in (a).
When using MRI for repeated imaging, the changing MRI characteristics of the clot with time, which has been detailed by Del Bigio et al. as early as 1996, have to be taken into consideration. These MRI changes are related to the gradual degradation of oxyhemoglobin via intra- and extracellular deoxyhemglobin, methemoglobin to hemosiderin and the thereby changing T2 and T1 effects (14).
Irrespective of the used sequences, hematoma volumes were consistently calculated by tracking the boundaries of the hematoma manually or semiautomatically and multiplying the cross-sectional area on each slice with the slice thickness.
3.1.2 Evaluation of the Edema Volume
For evaluation of the perihematomal edema, T2-weighted fluid attenuation inversion recovery sequences (FLAIR) and standard T2-weighted images have been proven to be reliable (Fig. 2) (5,14). The edema volume is calculated by tracking the outer boundaries of the perihematomal edema, multiplying the surface areas on each slice with the slice thickness and then subtracting the hematoma volume from the hematoma plus edema volume. Up to now there has been no clear consensus as to whether the hyperintensity on FLAIR sequences reflects edema caused by blood degradation product-related brain damage or, at least in parts, acute ischemic brain damage (i.e., due to compression of perilesional arteries). Diffusion-weighted images (DWI) and calculation of apparent diffusion coefficient (ADC) maps seem to be helpful for differentiating between perihematomal ischemia and edema since diffusion is reduced in acute ischemia with cytotoxic edema and increased in vasogenic extracellular edema not related to ischemia (19). Perfusion-weighted images (PWI) necessitating the injection of gadolinium-DTPA for calculation of mean transit times may also allow differentiation of ischemia from edema (19). It should be noted that the diffusion and perfusion changes are quite subtle and cannot be directly visualized. Therefore, measurement of quantitative values in predefined regions of interest (ROI) is necessary to detect these differences.
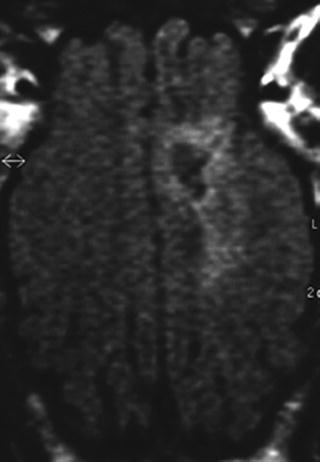
Fig. 2.
T2-weighted fluid attenuation inversion recovery sequences (FLAIR) have been proven to be reliable for the detection of perihematomal edema.
3.2 Computerized Tomography
Only few groups have proposed imaging of the hematoma with computerized tomography (CT). Shi and coworkers used CT scanning in piglets (20). The comparatively small volume of the pig brain in relation to the thick bone and the inability to visualize the edema properly are the major restrictions of CT scanning.
References
1.
Deinsberger W, Vogel J, Kuschinsky W, Auer LM, Böker DK (1996) Experimental intracerebral hemorrhage: description of a double-injection model in rats. Neurol Res 18:475–477PubMed
2.
3.
Küker W, Thiex R, Rohde I, Rohde V, Thron A (2000) Experimental acute intracerebral hemorrhage. Value of MR sequences for a safe diagnosis at 1.5 and 0.5 T. Acta Radiol 41:544–552PubMedCrossRef
< div class='tao-gold-member'>
Only gold members can continue reading. Log In or Register to continue
Stay updated, free articles. Join our Telegram channel

Full access? Get Clinical Tree


