Fig. 1.
Test arena for open field test.
At the beginning of the experiment, all animals are transported to the test room and left undisturbed for at least 30 min before the testing starts. Then, each animal is placed individually into the middle of one side of the arena facing the wall and allowed to explore it freely for 20 min. After each trial, the test arena is cleaned carefully with a disinfectant.
For data analysis, the arena is virtually divided by the software into two areas, the periphery defined as a corridor of 8 cm width along the walls and the remaining area representing the centre of the arena (41% of the total arena in our TSE system). The following parameters are calculated by the software: distance travelled, resting and permanence time as well as speed of movement for the whole arena, the periphery and the centre. Additionally, rearing frequency, percentage distance travelled and percentage time spent in the centre as well as the latency to first entry in centre and centre entry frequency are calculated. The time course of distance travelled, rearing frequencies as well as percentage distance travelled and percentage time spent in the centre are additionally analysed in 5-min intervals.
Alterations in the exploration of the exposed, central area are considered to reflect alterations in emotionality/anxiety. Reductions in spontaneous rearing activity can indicate balance and/or motor problems, and in such cases usually coincide with deficits in performance on the Accelerating Rotarod (see below). Reductions in distance travelled or speed of movement can indicate motor problems, but could also reflect other alterations, e.g. in motivation or in sensory modalities.
2.2.3 Pitfalls
Activity levels and exploratory behaviour in the Open Field depend on many factors, e.g. the shape, size and illumination of the arena, presence or absence of walls or floor texture (23, 27). Absolute values measured can also depend on the sampling rate of the equipment devices. Any stress before, as well as noise or any other disturbances during the test session, must be avoided to really get a baseline measurement of spontaneous activity. This usually requires tight control of activities outside of the testing room.
Most labs run several mice in the Open Field test in parallel, with multiple Open Fields situated in one room. In the GMC, we currently run two Open Field tests in parallel, with each Open Field apparatus situated in an approximately 1 × 1-m small room so that each Open Field apparatus is individually enclosed, i.e. the animal is isolated, and thus more sheltered from any visual, acoustic and olfactory stimuli during testing. We found that increases in Open Field activity induced by restraint stress are more reproducible if parallel tests are run in individualised Open Field rooms, rather than in one big room (Annemarie Wolff-Muscate, unpublished observations).
2.3 Gait Analysis
2.3.1 Rationale
Disturbances or problems with gait are characteristic features of several neurodegenerative disorders, like Parkinson’s disease, Huntington’s disease or amyotrophic lateral sclerosis. Walking includes important aspects, like coordination, balance and proprioception and there are some (genetic and pharmacological) mouse models of neurodegenerative disorders that replicate particular aspects of the disease, including gait disturbances (28–31). For a detailed analysis of motor coordination, mice are tested in the automated gait analysis system “CatWalk” (Fig. 2; Noldus, Wageningen).
2.3.2 Method
For gait analysis, the mice ambulate in a dark room over an elevated glass walkway (plastic walls, width 8 cm, length 100 cm), which is illuminated along the long edge with a fluorescent tube. The light is completely internally reflected until the mouse paw makes contact with the glass. The light escapes, is scattered and the contact area becomes visible. The brightness of a print represents the pressure exerted on the glass floor by this paw. A camera (Pulnix Camera RM-765) situated below the middle of the walkway tracks the footprint pattern that is converted by a frame grabber into a digital image, which can be analysed with the “CatWalk” software Version 7.1.
Data are collected without knowledge of group assignment in at least three uninterrupted runs per animal. To circumvent variability based on the acceleration and deceleration caused by the initiation and ending of walking, we record a field of view of 40 cm in the middle part of the walkway to get four- to eight-step cycles during the middle of each pass. The recorded runs can be analysed in different ways. For a qualitative description, the walking pattern can be visualised in a manner similar to the print marks a mouse would leave by running over a paper with its paws dipped in ink. Moreover, a time-based gait diagram, representing the duration of contacts with the glass plate (stand), is available. The footfall patterns window shows the order in which the paws are placed and indicates the corresponding step sequence categories. Additionally, the print intensity curves for each single paw placement are shown in a graphical feature.
For a quantitative analysis, the CatWalk software automatically calculates a wide number of parameters in several categories: parameters related to individual footprints, for example the width and length of a paw print, the duration of contact and the pressure exerted by a paw. In order to correct for body weight differences, values are also expressed as ratios between contralateral paws. Parameters related to the position of footprints are, for example, stride length and base of support (average width between either the front paws or the hind paws). Parameters related to time-based relationships between footprints are, for example, footfall patterns and phase dispersions. Max contact at (%) reflects the time of maximum contact at which the largest part of a paw contacts the glass plate during the total time of the contact, relative to the duration of the stand phase of an individual paw placement and can be seen as the point where the braking phase turns into the propulsion phase.
To quantify the time-based relationships between footprints, the CatWalk software uses the correspondence of the initial contacts between the paws to calculate the interpaw coordination with phase dispersions (PhDs) and couplings. To describe the temporal relationship between the placement of two paws, the timing between the initial contacts of an anchor to a target paw is expressed as the percentage of the total step cycle time, which is the time between two initial contacts of a paw. For diagonal (right fore paw–left hind paw (RF–LH) and LF–RH) and ipsilateral (RF–RH; LF–LH) pairs, the forepaw is designated as the anchor of the reference paw, and for girdle (LF–RF; LH–RH) pairs, the right paw is designated as the anchor. In rodents, for the diagonal pairs, the target paw normally runs synchronously with the anchor paw, so the initial contacts occur at the same time resulting in a PhD value around 0%. The PhD value for girdle pairs, paws that alternate, usually results in approximately 50% when walking with a moderate speed. A positive PhD value indicates that the target paw makes initial contact after that of the anchor paw. A negative PhD value indicates that the initial contact of the target paw preceded that of the anchor paw. When PhD exceeds 75%, the target paw is more closely associated with the next anchor paw. Therefore, in that case, the target is assigned to the next anchor, leaving the previous anchor without a target, resulting in a PhD of −25%. Couplings are computed in the same way as PhD. However, in the case of couplings, a target paw can never precede an anchor paw. Therefore, the value of couplings ranges between 0 and 100.
For a more detailed description of the Catwalk method, see (32).
2.3.3 Pitfalls
To get nice footprints without disturbing signals produced by dirt, it is essential to clean the glass plate accurately with a good glass cleaner. Since urine and faeces produce also signals, it is sometimes necessary to clean the glass floor several times while testing the same mouse. We do not train the mice in the CatWalk before testing, since we want to see their spontaneous walking behaviour, and in our experience this is not necessary to get appropriate runs. Normally, mice start to run repeatedly from one side to the other without any interruptions after they have explored the gangway with a few slower crossings. Mice that are less active, very old or anxious often need a bit more time to acclimate and perform good runs. If it is not possible to get enough good runs, the mouse can be tested again at another time point. Testing within a more active phase of the day is normally sufficient. Very active or aroused mice tend to run very fast in the early crossings. These trials should not be taken for analysis.
2.4 Beam Walking
2.4.1 Rationale
The Beam Walking test is widely used to examine sensorimotor function in rodents. In this test, the animals have to traverse an elevated beam and their performance is observed and rated. The method is well-established to assess and follow up sensorimotor coordination after neuronal injuries, like stroke (33, 34), ablation (35, 36) or pharmacological treatment (37). But also the influence of training or aging on sensorimotor function has been studied in rodents with or without injury, as well as in genetic and pharmacological disease models (30, 38–40).
2.4.2 Method
Mice have to traverse a 1-m wooden round beam (15 mm diameter) that is elevated 14 cm above the bench attached with tape to a neutral cage as the starting point and the mouse’s home cage as the goal box (Fig. 3). The Beam Walking test starts with a short training period, in which the animal is repeatedly (about five times) placed on the beam to learn to traverse the beam at a single blow. Initially, the animal is allowed to start on a position on the beam directly next to the home cage so that the mouse finds the way home quite easily. In the successive training trials, the distance from the start position to the home cage is increased stepwise until the full length is achieved. During the first training trials, some mice have to be encouraged by carefully nudging and pushing, but normally they rapidly learn to traverse the beam. After a recovery time of about 5 min, three to five testing trials are conducted with 5-min intertrial intervals (ITIs). The mice are placed at one end of the beam and have to walk over the full length of the beam to their home cage. The time needed to traverse the beam and the number of foot slips (one or both hind or front limbs slipped from the beam) and number of falls off the beam are measured. If mice fall, the timer is paused, the mice returned to the position on the beam they fell from and the timer restarted. In addition, in particular when video recording the beam crossings, other aspects like the number of steps or body posture can be analysed as well.
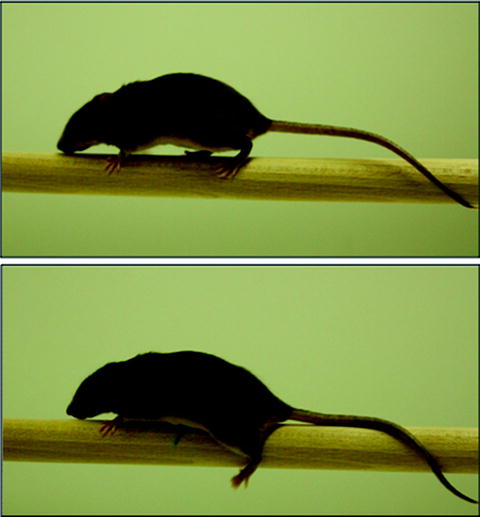
Fig. 3.
Beam walking. The upper picture shows normal performance. The lower picture depicts a hind paw slip.
2.4.3 Pitfalls
In the case that a mouse does not start walking on the beam, it sometimes helps to pull it slightly on the tail (backwards). Some animals (very fat or very old) are not able to walk over the beam properly, making an excessive number of slips or showing an ungainly kind of gait, lying flat on the beam with its hind legs clasped around it, stretching and drawing the body forwards just by the front limbs. Such a trial would pass with a maximum number of slips recorded, calculated by the mean number of normally executed steps on the beam with the hind paws (i.e. 20). But while training, you should try to show/teach such a mouse how to walk over the beam with all four paws by bringing the body in the right position and supporting the walk by holding it by the tail. The amount of training trials should be the same for all mice.
2.5 Ladder
2.5.1 Rationale
Animals are required to walk along a horizontal ladder on which the spacing of the rungs is variable to assess skilled walking, limb placement and limb co-ordination (Fig. 4). Walking across the ladder needs precise paw placement and grasping movements. The irregular rung arrangement demands adjustment of paw placement, stride length and also of the regular limb co-ordination. Additionally, each footfall requires control of the body weight support to immediately correct for any paw misplacement. Animals with deficits in the motor system have problems to adjust to the irregular spacings, whereas normal animals are able to do this within a few trials. The ladder walking test has been shown to be sensitive to chronic movement deficits after adult and neonate lesions to the motor system, including rat models of stroke (41–44), Parkinson’s disease (45, 46) and spinal cord injury (47, 48).
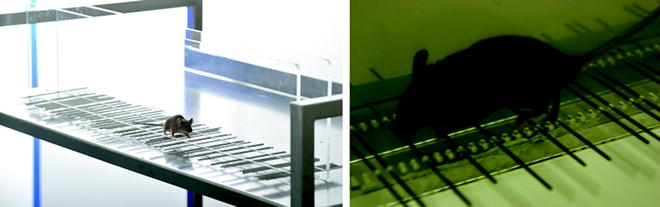
Fig. 4.
Ladder with irregular rungs.
2.5.2 Method
The ladder apparatus is a 1-m long horizontal ladder (5 cm wide), enclosed with transparent walls (20 cm high) with irregular spacings (0.5–2 cm) between the rungs that become wider at the end of the gangway. All animals have to cross the ladder in the same direction. For the analysis, the time the animal needs to traverse the ladder is recorded and the number of front and hind paw misplacements is counted. The number of stops and the time an animal is stationary can be included in the measurement too.
2.5.3 Pitfalls
For the ladder test, training is not usually necessary, as mice normally start to run over the ladder more or less uninterrupted when placed in the start area. If a mouse does not start walking over the ladder, it sometimes helps to pull it slightly on the tail (backwards) before it is allowed to start. After a few runs, many mice start to explore the apparatus by poking their nose through the rungs or turning around midway (which should be prohibited), making it impossible to get valid data. Some mice show this behaviour in the first trials and afterwards begin to cross the ladder uninterrupted. Therefore, we collect data from the first exposure onwards. Afterwards, we decide for the entire cohort of mice if these first trials count as training or testing trials.
2.6 Vertical Pole Test
2.6.1 Rationale
The Vertical Pole test is used to test the motor co-ordination during turning behaviour in mice (Fig. 5). The test was developed to assess basal ganglia-related movement disorders and is regarded to be highly sensitive to nigrostriatal dysfunction (28, 29, 49–52). MPTP-treated mice display slower times compared to controls, and the impairments can be reversed by l-DOPA (49–51).
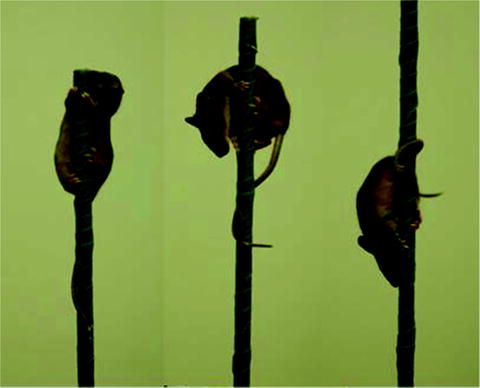
Fig. 5.
Vertical pole test. Left: Start position. Middle: Turning. Right: Descending.
2.6.2 Method
The apparatus consists of a 50-cm high, taped pole (diameter 1 cm). When the animals are placed head upwards on the pole, they orient themselves downward and descend the length of the pole to the ground. To bring the mouse in the right start position, the pole is tilt over nearly horizontally. While putting it up, the mouse’s tail has to be held fixed on the pole by the experimenters’ fingers; otherwise, the mouse starts turning before the vertical position is reached.
The time to turn downwards and the time to descend are measured and according to the performance of the mouse, each trial is scored on a scale of 5–0: 5 = turning on top, 4 = turning below midway, 3 = descending sideways, 2 = backwards, 1 = falls/springs, 0 = stays over 60 s on top. With ITIs of 5–10 min, the mice receive two training trials and three to five test trials.
2.6.3 Pitfalls
Since we frequently test older mice, we fixed at the base of the pole a foam rubber to prevent the mice from injuries by falling down. To keep up the mouse’s motivation for the task, it should be brought back to the home cage directly after it has reached the base. Normally, the mice start to orient themselves downwards immediately after the experimenter’s hand is taken off the tail, so the experimenter has to be very quick starting the timer. When the mouse does not start immediately, the experimenter has to be aware of the moment when the mouse starts to turn and to note this time point so that the exact duration of the turning movement is measured as well as the latency to turn, which can be an indication for an akinetic phenotype.
If the mice, especially older or overweight ones, do not start with the downward orientation by themselves, they sometimes need to be shown how to do this and the amount of training trials can be increased. For this, the experimenter moves the tail of the mouse to one side (try left and right!), whereupon the majority of mice start to turn their body to the opposite side and learn after few trials to do the task. If this is not sufficient or the mouse cannot hold on tight to the pole while turning, it can be further supported by guiding slightly on the tail.
2.7 Accelerating Rotarod
2.7.1 Rationale
The Rotarod test is used to assess motor co-ordination and balance in rodents (16, 53, 54). Mice have to keep their balance on a rotating rod, and that requires a variety of proprioceptive, vestibular and fine-tuned motor abilities. The time (latency) it takes the mouse to fall off the rod rotating at different speeds or under continuous acceleration (e.g. from 4 to 40 rpm) can be measured.
2.7.2 Method
Motor coordination and balance are assessed using the Rotarod apparatus from Bioseb (Fig. 6; Letica LE 8200) with an accelerating speed of the rotating rod from 4 to 40 rpm in 300 s. The rod diameter is approximately 4.5 cm made of hard plastic material covered by soft rubber foam (cut from insulation material to cover water pipes) with a lane width of approximately 5 cm.
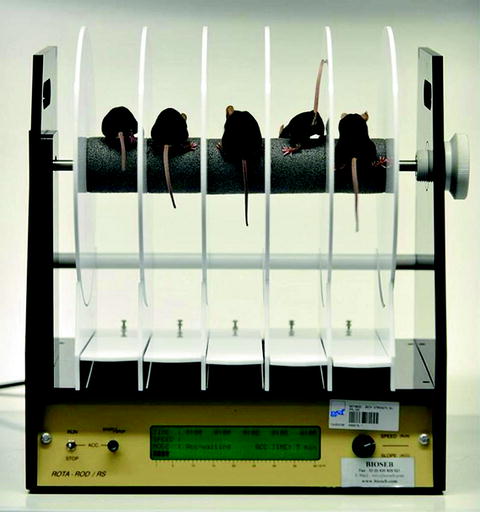
Fig. 6.
Rotarod apparatus.
The test phase consists of three trials separated by 15-min ITIs. On each trial, three mice are placed on the rod leaving an empty lane between two mice. The rod is initially rotating at 4 rpm constant speed to allow positioning of all mice in their respective lanes. Once all mice are positioned, the trial is started and the rod accelerated from 4 to 40 rpm in 300 s. Latency and rpm at which each mouse falls off the rod are measured. Passive rotations are counted as a fall and the mouse is immediately carefully removed from the rod. After each trial, the apparatus is disinfected and let dry. The accelerating Rotarod protocol is carried out according to the standardised phenotyping screens developed by the EUMORPHIA partners and available at http://www.empress.har.mrc.ac.uk.
2.7.3 Pitfalls
We perform the Rotarod test without training trials, but sometimes it is necessary to show or motivate the mice (especially old mice) in the beginning to stay on the rotating rod. This can be done by slightly pushing or lifting up the mouse while the rod rotates with constant speed before starting the increasing speed modus.
2.8 Grip Strength
2.8.1 Rationale
The Grip Strength test measures the muscle strength of forelimbs and combined forelimb–hind limb grip strength of mice (55).
2.8.2 Method
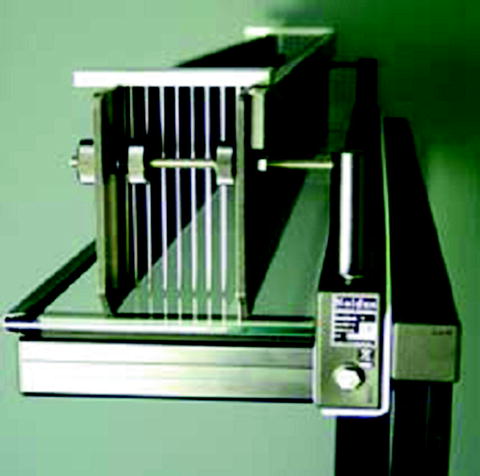
To measure the grip strength of mice, we are using the commercially available Grip Strength Meter apparatus (Fig. 7; Bioseb or TSE). The system is supplied with a single grid (400 × 180 × 200 mm) which connects to the sensor.
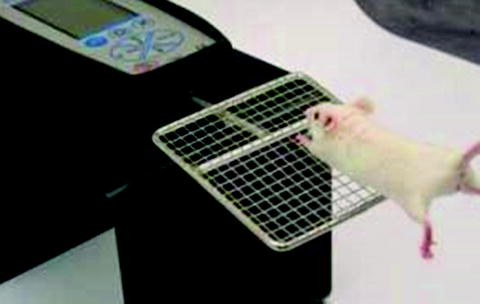
Fig. 7.
Grip strength meter, forelimb measurement.
This protocol is carried out according to the standardised phenotyping screens developed by the EUMORPHIA partners and available at http://www.empress.har.mrc.ac.uk. For the forelimb measurement, the mouse is lowered gently over the top of the grid so that only its front paws can grip the grid. Keep the torso horizontal parallel to the grid and pull the mouse back steadily (not jerking) until the grip is released down the complete length of the grid. When the animal releases the grid, the maximal grip strength value of the animal is displayed on the screen. Record the value manually/automatically. Forelimb and hind limb measurement: Gently lower the mouse over the top of the grid so that both its front paws and hind paws can grip the grid. Keep the torso parallel to the grid and pull the mouse back steadily (not jerking) until the grip is released down the complete length of the grid. Record the value manually/automatically. Three trials per condition are carried out, alternating forelimb strength only, and the combined forelimb/hind limb grip strength.
2.8.3 Pitfalls
For the evaluation of the results, it is essential to weigh the animal, since body weight influences the grip force (56). Mice with missing digits (e.g. after toe clipping) or other injuries on the claws should be omitted from this test. When testing the fore paw grip strength only, take care that the mouse cannot reach the grip with its hind paws.
2.9 Social Discrimination
2.9.1 Rationale
The social discrimination test allows the assessment of social recognition memory formation by exposing a test animal to conspecifics and measuring the time of active investigation of the stimulus animals, relying mainly on olfactory function. It makes use of the natural tendency of mice to investigate novel stimuli more than known ones. It is a discriminatory task, since the novel and the familiar stimulus animals are presented together during the test session.
2.9.2 Method
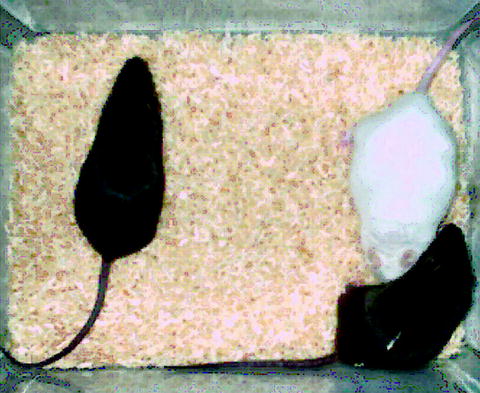
We use a modified version of the social discrimination procedure previously described by Engelmann and co-workers (57, 58). Adult ovariectomised 129S1/SvlmJ female mice are used as stimulus animals. The test animals are separated by transferring them to fresh cages 2 h before starting the session, and the illumination level in the testing room is set at approximately 200 lux. The social discrimination procedure consists of two 4-min exposures of stimulus animals to the test animal in the test animal’s cage (Fig. 8). During the first exposure (“sampling”), one stimulus animal is exposed to the test animal, and after a retention interval of 2 h this stimulus animal is re-exposed to the test animal together with an additional, previously not presented stimulus animal during this second (“test”) exposure. During each exposure, the duration of investigatory behaviour of the test animal towards the stimulus animal(s) is recorded by a trained observer blind to the genotype with a handheld computer. Data are analysed by using the Observer 4.1 Software (Noldus, Wageningen). A significantly longer investigation duration of the unfamiliar stimulus animal compared to the familiar one (i.e. the conspecific previously presented during the sampling phase) is taken as an evidence for an intact recognition memory. A social recognition index is calculated as time spent investigating the unfamiliar subject/time spent investigating both subjects.
 < div class='tao-gold-member'>


Only gold members can continue reading. Log In or Register to continue
Stay updated, free articles. Join our Telegram channel
Full access? Get Clinical Tree
