Mouse number
BW (g)
Glucose solution volume (μl) to inject
Glucose levels (mg/dL)
0 min
15 min
30 min
60 min
120 min
1
2
3
4
5
6
5.
Store sterile 20 % glucose solution and human insulin solution (100 U/mL) at 4 °C and bring them to room temperature for the tests. Prepare one syringe per mouse with the volume of glucose or insulin according to BW. Using two or more glucometers is also recommended in order to avoid overlapping of measurements.
6.
Blood sampling for small volumes is most commonly obtained from the tip of the tail, and the subsequent samples are obtained by gently removing the scab and repeating the massaging procedure. Avoid excessive bleeding as it might affect mouse welfare and results.
7.
Fasting basal glucose levels will be t = 0 in the GTT and the ITT curve.
8.
Space the injections of each mouse about 1–2 min to facilitate glucose measurements and to avoid overlapping of timings and take into account for the following bleedings. Remove all air bubble from the syringes. Make the injection with an angle of 25° to avoid subcutaneous injection and below the visceral area. In obese mice, make sure to avoid fat pad areas to successfully inject the glucose or insulin load.
9.
For measurement of insulin levels by ELISA, use an ultrasensitive commercially available kit and follow the instructions. Usually 5 μl of plasma is enough for determination of insulin concentration, but if a larger volume is required for the ELISA, plasma can be diluted in saline solution. Plasma samples can be also stored at -20 °C until later ELISA determination.
10.
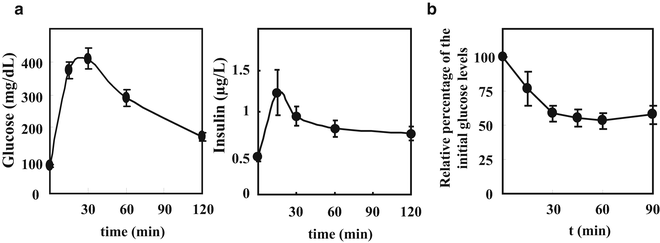
Results are depicted as glucose levels (mg/dL) in the Y-axis versus time (min) in the X-axis (Fig. 1). For comparisons among different mouse groups, the Area Under the Curve parameter (AUCglucose) is typically used. This parameter is obtained by calculating the area generated by the glucose disappearance versus time over a period of 2 h in the GTT. Higher AUCglucose parameter compared to a control group indicates increased glucose intolerance; in contrast, smaller AUCglucose value indicates faster glucose disappearance and therefore improved glucose tolerance. To analyze the glucose-stimulated insulin secretion during the test, insulin results from the ELISA are also depicted as insulin levels (μg/L) in the Y-axis versus time (min) in the X-axis (Fig. 1). For comparisons among different mouse groups, the AUC parameter (AUCinsulin) obtained by calculating the area generated by the insulin versus time over a period of 2 h in the GTT can be used. Higher AUCinsulin parameter compared to a control group might indicate increased capacity of pancreatic islets to secrete insulin induced by the glucose load, the so-called glucose-stimulated insulin release. However, additional studies are needed to reach such a conclusion, such as β-cell area measurement in the pancreas and in vitro insulin secretion by isolated islets.


