Table 65-2 A 2 × 2 Table Constructed for Chi-Square Test (as Described in Text)
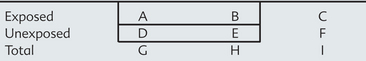
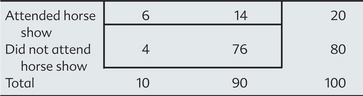
Table 65-3 Example of Chi-Square Table (as Described in Text)
CHAPTER 65 Epidemiology of Equine Infectious Disease
BASICS
Definition
Epidemiology is the study of the occurrence of disease in populations1 and the application of this knowledge to control or prevent disease. The underlying tenet of epidemiology is that disease does not occur randomly in a population. This means that there are always reasons why some horses become sick and others stay healthy, even if we do not always understand those reasons. This has tremendous implications for veterinarians: they can identify causes and risk factors for disease and take actions to prevent or decrease the impact of a disease. In this sense, it is critical to consider more than just disease agents and hosts; it is also critical to consider the environment and management factors that impact interactions among agents and hosts. Because of this broader implication, epidemiology is also sometimes defined as “medical ecology,” as discussed below.
The mare reproductive loss syndrome outbreak in Kentucky in 2001 was an excellent example of epidemiology in action.2 Even before veterinarians and producers understood the etiology of this disease, veterinarians were able to use epidemiology to identify risk factors for disease (exposure to eastern tent caterpillars2 or pasture3), which allowed farm managers to implement control measures and prevent some abortions that would have otherwise occurred.
Disease Ecology
Mare reproductive loss syndrome (MRLS), which was initially reported among broodmares in central Kentucky in 2001, is one example of disease arising from a combination of host, agent, and environmental factors. An epidemic of equine abortion, endophthalmitis, and pericarditis began in late April 2001 and lasted until June 2001;4–6 fetal losses occurred both early and late in pregnancy3,7 and affected more than 60% of mares on some farms.7 Multiple bacterial species were identified8 in tissue of aborted fetuses. The syndrome was subsequently found to be associated with ingestion of the eastern tent caterpillar,4 and it has been proposed that bacterially contaminated barbed caterpillar hairs migrated out of the alimentary tract, spread hematogenously, and were directly responsible for the observable signs of MRLS.9 Eastern tent caterpillars are ubiquitous in the eastern United States but were particularly abundant in Kentucky that spring because a rapid temperature increase in early spring was superimposed on an unusually dry winter and spring.10 These climatic conditions caused an explosion of biologic activity, including growth of black cherry trees on which eastern tent caterpillar eggs are laid and larvae develop.11 During that spring with its unusual climactic conditions, grazing on pasture4 with black cherry trees12 exposed horses to disease; fetuses were particularly vulnerable. The sensitivity of the fetus to disease, the environmental conditions that led to the overgrowth of caterpillars, the bacteria themselves, and the management of the broodmares all contributed to the occurrence of MRLS.
Disease Agent
Characteristics of the disease agent, including infectivity, contagiousness, pathogenicity and virulence, immunogenicity, host range, life cycle, and antimicrobial susceptibility, influence the speed and scope of disease spread. Infectiousness (infectivity) refers to the ease with which an agent infects susceptible hosts, which is sometimes quantified in relation to the amount of agent required to reliably infect an individual. Contagiousness relates to the likelihood that an agent will move between infected and susceptible hosts; it is sometimes quantified by the number of new infections that will likely result from exposure to an infected animal or as the speed with which a disease agent is transmitted through a susceptible population. Equine influenza virus and equine herpesvirus are both highly infectious, but influenza virus is more contagious. Although equine protozoal myeloencephalitis (EPM) is an infectious disease, it is not a contagious disease because the etiologic agent is not transmitted directly between horses. Pathogenicity describes the likelihood that an infected horse will develop clinical disease, and virulence describes the likelihood that disease will be severe. West Nile virus (WNV) is highly virulent in horses; more than 30% of horses with clinical disease die.13 In contrast, EPM is not highly pathogenic; most equids exposed to the disease agent do not develop clinical disease.14–16
Characteristics of the disease agent that enable it to survive and spread without detection are particularly important to consider when instituting preventive or control measures. Agents that can persist in the environment, such as Clostridium difficile17 or Streptococcus equi subsp. equi, require different control measures than does equine influenza, which does not persist well outside the host. Some diseases spread undetected through infected horses without clinical signs of illness. Subclinically, persistently, and latently infected animals are often important reservoirs and sources of exposure for susceptible animals in a population because they go unnoticed or undiagnosed. Animals often are infected with a potentially pathogenic organism without showing clinical signs, and this can even be the predominant presentation depending on the pathogenicity of the agent. The term subclinical is also used to describe animals during the induction or incubation period for infectious diseases. Animals that remain infected for extended periods are sometimes described as being “persistently infected,” especially if infections continue after clinical signs of disease resolve. Persistent infection and long-term shedding of S. equi subsp. equi are common18–20 and important to the spread of disease among populations.20,21 In contrast, latency describes a state of dormant viral infection in which shedding stops and the virus cannot be detected until later, when the infection reactivates or recrudesces. This is a common feature among alpha herpesviruses, such as equine herpesvirus (EHV) types 1 and 4.22–29
Environment
A horse’s environment includes its location, climate, and the local surroundings and interactions created by its management.30 Characteristics of a horse’s environment affect which diseases and vectors a horse is exposed to, the magnitude of that exposure, and the likelihood of developing disease if exposed. Horses that have been vaccinated with efficacious vaccines or immunized by natural exposure are more resistant to a particular disease than naive horses. Horses that are stressed for any reason, including poor diet, concurrent disease, weaning, transport, or mixing, are more likely to develop a disease than their unstressed counterparts. The risk of disease is not equal for similar horses when managed differently or housed in different environments.
Population.
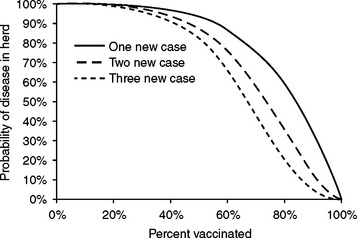
In addition to characteristics of individuals that affect their disease risk, the aggregate characteristics of the population to which the individual belongs affects the disease risk for that individual. This aggregate of the population’s susceptibility to disease is often called herd immunity, described as immunity of an individual that is conferred by the population to which it belongs, or the ability of a population of animals to withstand exposure without succumbing to disease because the immunity of a population is more than the sum of its parts.31 Herd immunity is created when the likelihood is small that an infected horse shedding a disease agent will encounter a susceptible horse (Fig. 65-1). If most horses are immune or if contact among horses is heavily restricted, it is unlikely that the few susceptible horses will have contact with the infected horse sufficient to allow transmission. For example, consider a barn in which 90% of horses are immune to influenza virus, and each horse in the barn contacts four other horses per day. If a newly introduced horse happens to be infected with influenza virus, and conditions are adequate for transmission of virus to in-contact horses, the probability that any other horse in the barn will become infected is about 35%, and the probability that more than one horse will become infected is about 12% (Fig. 65-1). For herd immunity to be effective, the disease agent (e.g., influenza) must only reside in horses, must not have an environmental reservoir, must be transmitted directly from horse to horse, and must have a short infectious period.32
Disease Causation
Many veterinarians are accustomed to thinking that infectious diseases have a single cause: the disease agent. Epidemiologists think of cause in a more general sense. Any “exposure” that leads to new cases of disease can be considered a “cause” of that disease. By removing that exposure, therefore, some cases of disease can be prevented. Causation has multiple levels. Again, consider MRLS. What “exposures” are associated with MRLS? The bacteria on the caterpillar hairs,8 the caterpillars themselves,33 exposure to cherry trees,2 pasture grazing,3,7 and the convergence of climatic factors resulting in caterpillar overgrowth have all been implicated in the epidemic occurrence of MRLS. Epidemiologically, all these factors are causes. Cases of disease can be reduced by removing bacteria from the caterpillars (an obviously impractical approach), minimizing exposure to caterpillars, reducing exposure to environments shared with the caterpillars (cherry trees or pasture), or returning to a more typical climate, as happened in subsequent years.
Likewise, consider encephalitis associated with WNV infection. This agent is propagated in a mosquito-bird-mosquito life cycle.34 West Nile virus can replicate in multiple mosquito species,35 although its primary vectors are Culex mosquitoes36 The primary hosts are birds,37 which develop transient viremia followed by long-term (lifelong) immunity. Ticks may also play a role in maintenance of WNV.35,38,39 New cases of equine disease can therefore be reduced by minimizing exposure to mosquitoes and ticks (e.g., controlling vector populations, using animal-safe repellents, housing horses inside at dusk and dawn) or by increasing immunity to the virus, either in birds or in horses. In birds the natural immunity that develops after initial exposure reduces the total amount of virus circulating in the mosquito population, which in turn reduces equine exposures. The increase in WNV immunity among birds is one likely reason that the number of reported equine cases of WNV-associated disease in Colorado was 378 and 426 in 2002 and 2003, respectively, and then decreased to 33 in 2004.40
One useful model used to understand complex causal relationships is to classify causes as component causes, necessary causes, or sufficient causes.31 In this model, a component cause is anything that contributes to new cases of disease. Component causes can be characteristics of the host (e.g., age, vaccination status), the agent (e.g., subtype), or the environment (e.g., presence or absence of caterpillars). A sufficient cause is any set of components that, when present together, is capable of causing disease; once a sufficient cause is present or complete, disease will occur. A necessary cause is a component cause that must be present for disease to occur; without the necessary cause, disease cannot occur. For infectious diseases, exposure or infection with the infectious agent is never sufficient by itself, but it is necessary for disease to occur.
IDENTIFYING CAUSAL FACTORS
For example, in a study to identify the risk factors associated with equine protozoal myeloencephalitis (EPM), horses affected with EPM and nonaffected horses were compared using a case-control study design.41 In that study, presence of opossums on the premises, lack of feed security, and recent occurrences of major health events, among other factors, were associated with an increased likelihood of disease and thus were identified as potential risk factors for the disease.41
Measuring Disease
Disease can be measured in whole populations or in specific subgroups. Measuring disease in the whole population (sometimes called a “crude” measure) tells you about the overall scope of the problem. Measuring disease in subgroups (called “specific” measures) enables you to compare those groups, which is essential when attempting to identify factors affecting the occurrence of disease. For example, if you had 10 cases of neurologic disease on a farm of 100 horses, you could report that 10% of horses on the farm are affected, as a crude prevalence estimate. In contrast, you could also report that 8 of 25 (32%) horses grazing in Pasture A were affected and 2 of 75 (3%) horses in Pasture B were affected. These pasture-specific attack rates suggest that something associated with housing in Pasture A may be the problem.
Population-at-Risk
The term population-at-risk (PAR) refers to the group of individuals susceptible to the event of interest (e.g., infection, disease, death) at or during the time period of interest. The PAR is used as the denominator in calculations of measures of disease frequency and can include the entire population or only a population subset, depending on susceptibility or specific interest in certain subgroups. For example, in describing the frequency of pneumonia caused by Rhodococcus equi infections, only foals would likely be included in the PAR because adult horses are not considered susceptible to this disease.42
Using Categorical Data
Ratios, Proportions, and Rates.
Rates.
A rate is another special type of ratio. In epidemiologic terms, rate represents the average “speed” that health events will occur in a population over a specific or standardized amount of time. A rate is calculated as the number of events over the product between the total number of possible events and the time period during which each event could have occurred. A rate varies between 0 and infinity, and the units of the denominator are expressed in event-time (e.g., horse-years, horse-months). For example, 100 horses were followed for 1 year. Assume that 10 horses developed IURD in the middle of the year (0.5 year) and after this point were no longer at risk of IURD because of acquired immunity. The rate of IURD would be calculated as 10 cases/90 horses × 1 year + 10 horses × 0.5 year and expressed as 0.11 cases per horse-year, or 11 cases per 100 horse-years. Notice that the time units of the denominator can be changed as desired, and 11 cases per 100 horse-years is the same as 11 cases per 1200 (100 × 12) horse-months, which means that you expect approximately 11 cases of IURD if you follow 100 horses for 1 year or 1200 horses for 1 month. Similarly, 33 cases of IURD would be expected to occur if 100 horses were followed for 3 years. The word “rate” is commonly used to refer to a proportion; however, rates and proportions are different quantities and are calculated differently, even though they are sometimes used as approximations of each other.
Epidemiologic Measures of Disease Frequency
Prevalence.
Prevalence (P) is the proportion of cases of disease in a population at a specific point in time43 and is calculated as follows (PAR, population-at-risk):
Prevalence is used to assess the health status of the population at a single point in time. Therefore it is a static measure of disease frequency and does not allow strong inferences about previous or future occurrences of disease or how fast these occurrences accumulate over time. Prevalence measures are also used to describe the risk or probability of a condition being present in a population (Box 65-1). Note that in prevalence estimates the numerator includes all cases of disease present at the specific point in time (recent and chronic).
Cumulative Incidence.
The cumulative incidence (CI) is the proportion of new cases of disease occurring in a population during a specific time period43 and is calculated as follows:
Cumulative incidence is used to assess the progression of disease in the population during a specific time period and can be used to predict disease occurrence. The cumulative incidence measures the risk or probability of becoming diseased in a population during a defined time period (Box 65-2).
The cumulative incidence is an appropriate measure of disease incidence when the population is relatively “closed” (i.e., minimal movement of animals in and out of the population). When there is substantial movement of animals (“open” population), the cumulative incidence might underestimate or overestimate (bias) disease incidence,43 and the incidence rate, also called incidence density, is a more appropriate measure of disease incidence.
Other common measures that could be described as specific types of cumulative incidence include the attack rate, mortality rate, and the case-fatality rate. The attack rate is simply a different name attributed to the cumulative incidence in an outbreak situation and is calculated exactly as the cumulative incidence. The mortality rate is the proportion of all deaths (“crude” mortality rate) or deaths attributable to a specific disease (“cause-specific” mortality rate) over the total PAR of death at the beginning of the time period (Box 65-3). Note that these measures are called “rates,” but in reality they are proportions because they do not include time measurements in their denominator.
Box 65-3 Mortality Rate

The cause-specific mortality rate for deaths attributable to R. equi pneumonia was:

Mortality can be calculated as a proportion, as just noted, or as an incidence using one of the methods described next. The term “mortality rate” is commonly used to describe mortality in the population whether it is a proportion or an actual rate.
The case-fatality rate is the proportion of deaths attributable to the disease of interest during a specific period of time (Box 65-4).43 The case-fatality rate is calculated as follows:
Stay updated, free articles. Join our Telegram channel

Full access? Get Clinical Tree


