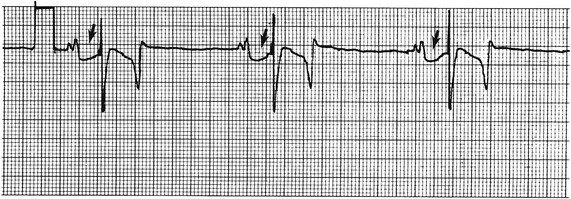
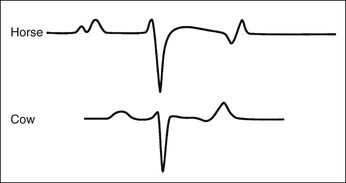
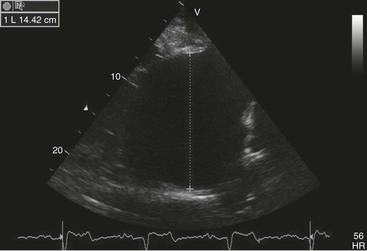
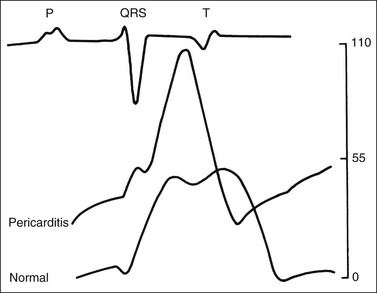
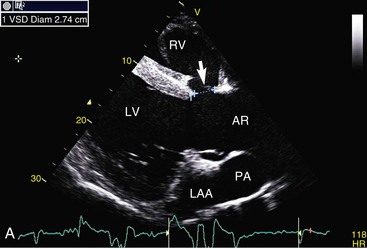
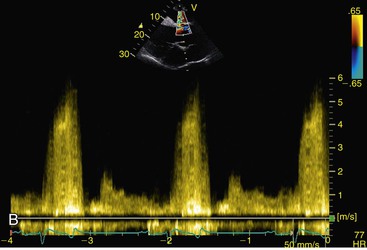
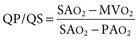
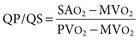
Virginia B. Reef, Consulting Editor Sheila M. McGuirk No single electrocardiographic lead system has been universally accepted for use in large animals. Bipolar leads (I, II, III, base-apex, X, Y, and Z of the orthogonal lead system) and unipolar leads (aVF, aVR, aVL, thoracic) have been described, but the amplitude, duration, and configuration of the different waveforms vary widely depending on an animal’s breed, size, body type, and sex. In addition, there is lability of certain waveforms within each animal depending on the level of exercise, excitement, or organic heart disease. Large animals have a deeply penetrating Purkinje system, and depolarization from the ventricular endocardium to the epicardium occurs explosively and in many directions at once. This period of ventricular activation is responsible for the electrocardiographic criteria that indicate ventricular enlargement in small animals but contributes little to generating the QRS complex of large animals. Establishing specific diagnostic criteria for chamber enlargement in large animal species has been difficult because changes in the QRS complex are not sensitive or specific for ventricular enlargement. The electrocardiogram (ECG) is used primarily to detect cardiac arrhythmias. For this purpose a single-channel machine can be used, and the lead system chosen can be any that generates distinctive P, QRS, and T complexes. If an arrhythmia is detected, another lead should then be obtained to further characterize the QRS and T complexes and confirm their origin. The lead system should be easy to apply, and the tracing free of artifacts created by muscle tremors, skin movement, shifting of weight, and changes in limb position. Two such leads commonly used to obtain a rhythm strip for the diagnosis of cardiac arrhythmias are the base-apex lead1 and the Y lead of the orthogonal lead system.2 The base-apex lead is attached by placing the positive electrode from one of three standard bipolar leads (lead I, II, or III) on the left thorax in the fifth intercostal space at the level of the elbow or at the location where the apex beat is most readily palpable. The negative electrode is attached to the skin of the right jugular furrow two thirds of the way from the ramus of the mandible to the thoracic inlet or at the top of the right scapular spine. The ground electrode can be attached to any site remote from the heart. Electrical contact is improved by clipping hair or wetting the skin with alcohol. The base-apex lead ECG is recorded by switching the machine to the bipolar lead that has been attached to the horse and recording the ECG (Table 30-1). Lead Y is attached by placing the positive electrode over the xiphoid and the negative electrode cranially to the front of the chest. TABLE 30-1 Standard Bipolar Electrocardiographic Leads Continuous electrocardiographic recording over a 24-hour or longer period (Holter monitoring) or with radiotelemetry is also useful for evaluating horses with arrhythmias. Continuous ECG recording can be performed with contact electrodes covered with moist sponges to maintain contact, electrode patches that are held against the skin with a surcingle, or electrode patches attached to shaved skin with a cyanoacrylate adhesive and protected underneath a surcingle.3,4 With bipolar contact electrodes using a single lead system, the positive electrode is placed over the left cardiac silhouette or over the sternum and the negative electrode is placed over the dorsum to the left of the withers where the electrode will lie flat and remain in contact with the skin.3 The electrodes are kept moist with alcohol and are then held in position with a tight surcingle. With electrode patches the electrodes are taped to a small square of cardboard to provide them with some rigidity. The best recording with a three-lead system is usually obtained with the left arm electrode placed on the sternum, the right leg electrode on the right side in the fifth intercostal space at the level of the point of the shoulder, and the right arm electrode placed on the left side in the fifth intercostal space at the level of the point of the shoulder. These electrodes are then held in position with a tight surcingle after removal of the plastic that covers the conducting material overlying the electrode. The electrodes are connected to a digital recorder that records the animal’s heart rhythm for the entire monitoring period (Holter monitor) or a telemetry device that sends the ECG signal back to the receiver to be displayed on a monitor. The entire recording or monitoring period can be stored on a smart card for subsequent analysis. The continuous 24-hour Holter ECG is useful for diagnosing arrhythmias that occur intermittently or for monitoring cardiac rhythm during exercise for later analysis. Radiotelemetry electrocardiography is useful for real-time cardiac rhythm monitoring during treatment or exercise. In the base-apex lead the P wave is positive in most horses and ruminants. The P wave is most frequently bifid in horses. In many horses a Ta wave, indicative of atrial repolarization, occurs as a negative deflection after the P wave (Fig. 30-1). The QRS complex begins with a small positive deflection (rS) and is followed by a large negative deflection that terminates in the ST segment. The T wave is variable and can be positive, negative, or biphasic in horses and ruminants. Frequently the appearance of the T wave is variable within one recording. Fig. 30-2 illustrates a typical base-apex ECG recorded from both a cow and a horse at a 25-mm/s paper speed with the gain set at 10 mm/mV. When a systematic approach is used to analyze the ECG, diagnosing arrhythmias is not difficult. The following step-by-step approach can be used: Echocardiography is a noninvasive diagnostic tool that uses sound waves in the range of 1.5 to 10.0 MHz to visualize the heart in motion, using either a single icepick (M-mode) or a two-dimensional (2D; B-mode) image. Noninvasive evaluation of blood flow in the heart and great vessels is performed with pulsed wave, color flow, and continuous wave Doppler echocardiography. Precise localization of abnormal flow within the heart and great vessels is performed with pulsed wave and color flow Doppler echocardiography, whereas continuous wave Doppler echocardiography is used to determine the peak velocity of blood flow and to noninvasively estimate pressure gradients. In contrast to M-mode and 2D echocardiography, in which the best image is obtained with the ultrasound beam perpendicular to the structures being imaged, optimal Doppler signals are obtained with the ultrasound beam parallel to the blood flow being evaluated. For accurate peak blood flow velocities to be recorded with continuous wave Doppler echocardiography, the ultrasound beam should be as close to parallel as possible (<20-degree angle) to the direction of blood flow being measured. This alignment is difficult or impossible to achieve in most large animals with valvular heart disease, so accurate peak blood flow velocities often cannot be obtained from large animals with valvular heart disease. Noninvasive estimations of pressure gradients are inaccurate in these instances. Alignment of the ultrasound beam parallel to shunt flow is possible with most ventricular septal defects (VSDs) because of the typical location of the VSD in the membranous or perimembranous portion of the interventricular septum. A more extensive review of the theory and application of echocardiography in horses and cattle has been published.5–11 More recently, tissue Doppler imaging (TDI) has been used in horses to evaluate atrial and ventricular myocardial wall motion.12–17 Echocardiography is particularly useful in evaluating large animals with cardiovascular disease, because the examination is noninvasive and can be performed in a timely fashion in most standing unsedated animals. Diagnostic criteria for valvular, myocardial, pericardial, and congenital lesions of the heart are well established, and the information obtained assists the practitioner in confirming a diagnosis, assessing the extent of the disease, determining the severity of cardiac dysfunction, monitoring the response to treatment, and providing an accurate prognosis. Large animal echocardiographic equipment should provide satisfactory resolution of images at depths of 26 cm or greater. Portable ultrasound machines are available that can display depths of up to 40 cm for equine and bovine cardiology. These machines are available with pulsed, continuous wave, and color flow Doppler. However, Doppler echocardiography is used mainly in specialty practices and referral institutions because performing and interpreting the echocardiogram, including Doppler, requires a significant amount of training and expertise. In addition, state-of-the-art color flow and tissue Doppler equipment remains fairly expensive, although it has decreased in price. Echocardiographic examination is performed in a systematic way, using standardized images to obtain information about chamber size, wall thickness, myocardial function, valve appearance, valve function, great vessels, blood flow, and presence of abnormal structures or echodensities. The standard equine or bovine echocardiogram is performed from the right parasternal window (right fourth intercostal space in horses and third intercostal space in ruminants) with a 2.5-MHz or lower frequency transducer. Higher-frequency transducers should be used to examine younger or smaller animals, South American camelids, and small ruminants. Both long- and short-axis views of all cardiac structures should be evaluated. The cardiac valves should be carefully examined for any abnormalities of structure or function (dysplasia, thickening, prolapse, ruptured chordae tendineae, fenestrations, flail valve leaflet, vegetative lesion, or high-frequency vibrations). The relative size, shape, and relationship of the cardiac chambers and great vessels should be assessed, and an evaluation of myocardial function and blood flow performed. Standard measurements of left ventricular internal diameter, left ventricular free wall thickness, interventricular septal thickness, and right ventricular internal diameter should all be obtained at end diastole and peak systole from the M-mode echocardiogram. The diameter of the aortic root and left atrial appendage, the distance between the interventricular septum and the peak opening of the septal leaflet of the mitral valve (septal to E point separation), and the left ventricular ejection time (ET) should also be determined. End-diastolic measurements are obtained at the Q wave of the ECG, whereas peak systolic measurements are made from the peak downward deflection of the interventricular septum. Calculations of fractional shortening (FS) and ejection fraction (EF) can then be performed to assess left ventricular function using the following formulas: in which LVIDd is the left ventricular internal diameter at end diastole (cm), LVIDs is the left ventricular internal diameter in systole (cm), and ET is the left ventricular ejection time (seconds). Echocardiograms should also be performed from the left cardiac window when the entire heart cannot be successfully imaged from the right side; atrial fibrillation is present; abnormalities of the mitral valve, aortic valve, pulmonic valve, aorta, pulmonary artery, left atrium, left ventricle, or outflow portion of the interventricular septum are suspected or detected; or murmurs originating from the mitral, aortic, or pulmonic valves are detected or a pericardiocentesis is planned. The maximal diameter of the left atrium should be obtained at peak systole from the left cardiac window at the level of the left coronary artery, parallel to the mitral valve (Fig. 30-3). The diameters of the aorta and pulmonary artery should be measured from similar locations in the vessel on the 2D echocardiogram and compared. Echocardiography should be considered a useful diagnostic test to evaluate patients with the following complaints, physical examination findings, or tentative diagnoses: 1. Cardiac murmur, to determine the etiology of the murmur a. Any grade 3/6 or louder holosystolic or pansystolic murmur on the left side of the thorax b. Any grade 4/6 or louder holosystolic or pansystolic murmur on the right side of the thorax c. Any holodiastolic decrescendo murmur d. Any continuous machinery murmur 2. Congenital heart defects, especially atrial septal defects (ASDs) and VSDs 3. Acquired valvular heart disease 5. Cardiac arrhythmias not associated with high resting vagal tone 6. Unexplained exercise intolerance or collapse or exercise intolerance attributed to cardiac causes 7. Muffled heart sounds, pericardial friction rubs, or pericardial effusion 8. Myocarditis or myocardial dysfunction 9. Congestive heart failure (CHF) 12. Aortic rupture or other abnormalities of the great vessels 13. Ionophore toxicity or exposure to other myocardial toxins Color flow or pulsed wave Doppler echocardiography should be used to map the size and location of a turbulent jet associated with an intracardiac or extracardiac shunt, valvular regurgitation, or stenosis (rare) and to semiquantitate its severity.18,19 Continuous wave Doppler echocardiography can then be used to measure the peak velocity of blood flow in the jet, estimating (noninvasively) the pressure difference between cardiac chambers using the Bernoulli equation and assessing the hemodynamic significance of the lesion. This can be accurately performed in most patients with a VSD but is difficult to impossible to accurately perform in many patients with valvular insufficiencies because of the limited windows available for interrogating blood flow in large animals and the inability to align the ultrasound beam to within 20 degrees of the abnormal blood flow. This poor alignment of the ultrasound beam with the regurgitant jet results in an underestimation of the peak regurgitant jet velocity. Contrast echocardiography, a technique involving microbubble-laden injections of saline, carbon dioxide, or indocyanine green, can also be used to demonstrate valve dysfunction and the direction of intracardiac shunts (VSDs, ASDs) and extracardiac shunts (patent ductus arteriosus [PDA], truncus arteriosus). TVI should be performed to look for left atrial dysfunction (left atrial stunning) post conversion of atrial fibrillation.16 TVI is also useful in identifying ventricular myocardial dysfunction.13 Cardiac and great vessel catheterization can be performed in standing unsedated large animals to determine the following data: • Pressure and waveforms (shape of the pressure curve) • Oxygen tension, oxygen saturation, oxygen content • Cardiac output and other indicators of ventricular size and function Cardiac catheterization is also used for special diagnostic studies such as angiocardiography, nuclear angiocardiography, and indicator dilution studies. These data are used to determine the direction and size of intracardiac and extracardiac shunts, chamber size and contractility, and valvular and myocardial function. Much of this information is now obtained noninvasively with echocardiography, minimizing the need for more invasive techniques. Cardiac catheterization is usually reserved for specialty practices and referral institutions, owing to the equipment needed and skills required for acquiring and interpreting accurate data. Results are not always specific, but catheterization can add quantitative measurements that increase diagnostic and prognostic accuracy for certain cardiac conditions and may provide a direction for therapy. Normal blood pressures for cattle and horses are listed in Table 30-2.20–23 The values for horses represent a summary of data from numerous authors as cited in the references given. Accuracy of pressure recordings is greatly influenced by the choice of catheter and the recording equipment used. Pulmonary artery wedge pressure (PAWP) is an indicator of left atrial mean pressure so long as balloon inflation of the catheter occludes flow in the segment of the pulmonary artery that is catheterized. PAWP is superior to central venous pressure (CVP) as a monitor of left ventricular function and fluid therapy. TABLE 30-2 Cardiac Pressure Measurements in Normal Horses and Cattle* * Pressure ranges are reported as systolic/diastolic (mean) in mm Hg unless otherwise designated. AO, Aorta; CA, carotid artery; LV, left ventricle; PA, pulmonary artery; PAW, pulmonary arterial wedge; RA, right atrium; RV, right ventricle. The shape of the pressure curve in the ventricles, aorta, or pulmonary artery may have diagnostic significance in conditions like constrictive pericardial disease (Fig. 30-4); pulmonic stenosis (giant A wave), rare as an isolated defect in large animals; or tricuspid or mitral valve regurgitation (large V wave). These conditions are more commonly assessed by echocardiography. An abnormal rise in pressure going from one chamber to the next indicates a stenotic lesion (uncommon in large animals) at the level of the pressure gradient. The size of the pressure gradient can be used to determine the severity of the lesion. Blood oxygen measurements are taken from the chambers on the right side of the heart to detect abnormal elevations indicative of a left-to-right shunt (ASD, VSD, PDA). Criteria for oxygen step-ups have not been established for large animals, but human guidelines have been accepted for qualitative assessment of shunts.24,25 In humans, oxygen content step-ups of the following magnitude are considered abnormal and indicative of a left-to-right shunt26: • ≥1.9 volume percent from the superior vena cava to the right atrium • ≥0.9 volume percent from the right atrium to the right ventricle • ≥0.5 volume percent from the right ventricle to the pulmonary artery Because oxygen content depends on hemoglobin concentration, oxygen saturation, which is independent of hemoglobin concentration, may be a more accurate indicator of shunts in anemic or polycythemic patients. Changes in the animal’s physiologic status during sampling (cardiac output, ventilation, oxygen consumption), incomplete mixing of shunted blood, and variable time intervals between sampling can be potential sources of error. Several samples within a single chamber improve reliability of results. Small shunts and shunts in animals with low systemic arterial oxygen tension may not be detected by this technique. Shunt calculations can be made once oxygen saturation or content has been measured in each of the right heart chambers, the pulmonary artery, and a systemic artery. For a left-to-right shunt, the pulmonary flow/systemic flow ratio (QP/QS) is determined as follows: in which SAo2 is the arterial blood oxygen content, MVo2 is the mixed venous blood oxygen content, and PAo2 is the pulmonary artery oxygen content. A 2 : 1 QP/QS represents a 50% left-to-right shunt, indicating that 50% of the pulmonary flow is from the left side of the heart. For a right-to-left shunt, the QP/QS is determined as follows: in which PVo2 is the pulmonary venous oxygen content (assumed to be 98% of oxygen capacity plus 0.3 mL of dissolved oxygen).27 Cardiac output is determined by indicator dilution methods (usually by dye dilution or thermodilution or, more recently, by lithium dilution), by the Fick method, or by using 2D or Doppler echocardiography. The Fick method requires use of a face mask and simultaneous determination of mixed venous and arterial blood samples. Dye dilution and thermodilution results are comparable when 30 to 40 mL of 5% dextrose are injected rapidly at 32° F (0° C).25 Lithium dilution compares favorably with thermodilution in anesthetized horses and foals.28,29 Volumetric echocardiography using the Bullet method achieves results similar to those obtained with the lithium dilution method in anesthetized foals.30 Transthoracic Doppler echocardiography was closely correlated with thermodilution in standing horses.31 Cardiac output values in the resting horse range from 32 to 40 L/min.32 Cardiac index is the cardiac output divided by a measure of body size (body weight in kilograms) and is expressed in mL/kg/min.32 The normal cardiac index for the adult horse ranges from 72 to 88 mL/kg/min.32,33 Cardiac output values of 20.9 to 23.6 L/min have been reported in normal anesthetized horses.28 In cattle a cardiac index of approximately 110 mL/kg/min has been reported.23 Cardiac output measurements in clinical patients vary with heart rate, excitement, hydration, and many other factors and are best determined in the pulmonary artery. Electronic integration and computation of area under the curve by means of battery-powered units that can display results instantly provide the most reliable results.34 Cardiac output results or indicator dilution curves can provide quantitative and qualitative assessment of cardiac shunts. Characteristic changes in the temperature-time curve (thermodilution methods) or dye concentration-time curve indicate the presence of a left-to-right, right-to-left, or bidirectional shunt. Calculation of the cardiac output in the chamber just proximal to the shunt and distal to it can give a quantitative estimate of the size of the shunt.25 Angiocardiography is used in neonates or animals small enough to have the entire cardiac silhouette visualized on a single radiograph cassette. The contrast medium must be injected rapidly, and in most cases this is done with a pressure injector. Specialized radiographic requirements include rapid film change capabilities, rapid image sequence acquisition, or cineradiography. Angiocardiography is used to confirm the presence of an intracardiac shunt (ASD, VSD) or extracardiac shunt (PDA, truncus arteriosus) or valve dysfunction, to visualize chamber size, or to estimate contractility. Angiocardiography is performed in anesthetized animals. In nuclear angiocardiography, specialized equipment captures sequential digitized images of the right side of the heart, lung, and left side of the heart after rapid injection of radiographic tracer into peripheral circulation. A more extensive review of this subject has been published.35 Nuclear angiocardiography can be used to confirm valvular dysfunction, which is manifested by chamber enlargement or prolonged washout of affected vessels or cardiac chambers and is quantitated by the regurgitant fraction. It also can reveal enlargement of chambers and prolonged washout resulting from cardiac failure. The presence of intracardiac or extracardiac shunts can be demonstrated by the simultaneous visualization of left- and right-side cardiac chambers or slow washout downstream of the shunt. In addition, nuclear angiocardiography can be used to calculate cardiac output and ejection fraction (EF) and other indices of cardiac function. The cause of congenital cardiac defects has not been established, although hereditary factors may be responsible for some defects. In humans, additional factors such as maternal infection, age, and nutritional status have been identified; fetal anoxia from placental insufficiency, fetal infection or metabolic dysfunction, or other causes may contribute to the development of congenital cardiac defects. The same factors may apply in animals. Congenital cardiac defects in large animals can occur alone or in combination. The most commonly reported is VSD.18,24,36–39 Multiple cardiac anomalies including PDA,40,41 tetralogy of Fallot,42,43 truncus arteriosus,44,45 total anomalous pulmonary venous connection,46 and Eisenmenger complex in calves47 have been reported. Congenital anomalies of the tricuspid,44,48–50 mitral,51 and pulmonic valves44,52,53 are uncommon. Congenital abnormalities of the aorta are reported in calves and foals but are also uncommon.39,54,55 ASD occurs more commonly in calves than in foals and is frequently accompanied by other defects.39,45,56,57 Hypoplasia of the left and right ventricles has been infrequently reported in calves and foals.39,58,59 Congenital cardiovascular disease should be suspected in a young patient if examination reveals a holosystolic (pansystolic), holodiastolic, or continuous murmur or a murmur with a palpable thrill or wide radiation over the thorax. Cyanosis at rest or with exercise in a patient with a cardiac murmur warrants consideration of a right-to-left cardiac shunt, obstructive pulmonary disease, or severe stenosis of the structures of the right side of the heart. The presence of any of these findings in a young animal with a history of lethargy, weakness, or failure to thrive constitutes grounds to suspect congenital cardiovascular disease. A VSD is an opening in the interventricular septum that creates a communication between the left and right ventricles. In large animals most defects occur in the perimembranous septum and are imaged ventral to the right and/or noncoronary leaflet of the aortic valve and cranioventral to the septal leaflet of the tricuspid valve, including or adjacent to the fibrous part of the interventricular septum.18,24,37,39 VSD can occur as a single defect or as part of a complex anomaly. Many cardiac malformations such as tetralogy and pentalogy of Fallot, truncus or pseudotruncus arteriosus, common atrioventricular canal defect, tricuspid atresia, and double outlet right ventricle include a VSD. The cause of VSD is unknown, although it has been documented to be a heritable defect in Limousine39 and possibly Hereford60 cattle. VDSs are more common in Welsh Mountain ponies (Section A) and in the Arabian, Standardbred, and Quarter Horse breeds, suggesting a possible hereditary predisposition.61,62 The defect is thought to result either from failure of fusion of a part of the endocardial cushion and the muscular ventricular septum or failure of fusion of the truncal and conal septa.63 The clinical signs of an isolated VSD vary and depend on the size of the defect, direction of the shunted blood, and presence of concurrent valvular or myocardial disease. In isolated VSD the blood flow is shunted from the left ventricle to the right ventricle through the defect in the interventricular septum. The size of the shunt depends on the size of the defect and the pressures in the left ventricle, right ventricle, and pulmonary artery. VSD is suspected when there is a loud, harsh, plateau-shaped pansystolic murmur with its point of maximal intensity (PMI) in the tricuspid valve area, and a slightly softer, more crescendo-decrescendo holosystolic murmur that is loudest in the pulmonic valve area. The murmur on the left side has its PMI in the pulmonic valve area, associated with a relative pulmonic stenosis (increased blood flow across a normal pulmonic valve). A palpable cardiac thrill usually is present over the tricuspid valve region, and occasionally there is splitting of the second heart sound. The murmur may be the only clinical sign identified if the defect is small. On the other hand, poor growth, lethargy, dyspnea, exercise intolerance, and signs of CHF can be exhibited by animals with a moderate to large VSD. This usually develops by the time the animal is 5 years old. Occasionally there is a diastolic murmur of aortic insufficiency associated with a large VSD, the location of which compromises the support of one of the aortic valve cusps.9,18,38 Cardiac arrhythmias, particularly atrial fibrillation, may be associated with VSD when there is cardiac enlargement or failure. If the systolic murmur is loudest on the left side of the thorax, a subpulmonic VSD or a complex anomaly with pulmonic stenosis (or some form of right ventricular outflow tract [RVOT] obstruction) should be suspected.9,18,38,64 The pulmonic murmur is usually louder than the tricuspid murmur in large animals with tetralogy of Fallot. Large animals with tetralogy of Fallot may have cyanosis at rest (uncommon in horses) or with exercise or exertion. Cyanosis is also a distinguishing feature of Eisenmenger complex, a defect in which right-sided heart resistance to blood flow causes the shunt associated with VSD to become right to left. Congenital abnormalities of the mitral and tricuspid valves cause a loud systolic murmur audible on both sides of the thorax. The PMI of the left-sided systolic murmur is more caudally located (in the mitral to aortic valve area) than the relative pulmonic stenosis murmur. Usually the murmur of mitral regurgitation is the louder of the two murmurs. In addition, congenital mitral or tricuspid valve dysplasia is rare in large animals. An innocent flow murmur of neonates can usually be distinguished from VSD by its crescendo-decrescendo shape, PMI at the left heart base, lack of radiation, and low to moderate intensity. Echocardiography is the diagnostic technique of choice for identifying a VSD. With 2D echocardiography the VSD can be imaged directly (Fig. 30-5) and the shunt size, location, and direction demonstrated with pulsed wave Doppler, continuous wave Doppler, color flow echocardiography, or injection of microbubbles. Careful scanning of the interventricular septum should be performed with 2D echocardiography to directly image the VSD and measure its maximal diameter in two mutually perpendicular planes.9,18,38 The typical perimembranous VSD (≤2.5 cm in both planes) is missed if the long-axis view of the left ventricular outflow tract (LVOT) is not examined. The membranous VSD is located underneath the right and/or noncoronary leaflet of the aortic valve and ventral to the septal leaflet of the tricuspid valve. If a perimembranous defect is not found, the entire septum should be carefully scanned in all imaging planes to detect the VSD. The subpulmonic location, more common in calves, is easy to miss. This defect is usually best imaged in the short-axis view, scanning the interventricular septum between the LVOT and RVOT. With a left-to-right shunt a high-velocity turbulent jet is depicted from the right parasternal window, originating in the left ventricle, traversing through the defect in the interventricular septum into the right ventricle with color flow Doppler echocardiography (blood flow toward the transducer), whereas a negative contrast jet is imaged in the right ventricle with a right-sided injection of microbubbles.9,18,38 M-mode echocardiography should reveal septal discontinuity when traversing the interventricular septum from the apex of the heart to the aortic root (septal dropout). Moderate to large VSDs show left atrial and left ventricular enlargement, right ventricular enlargement, and pulmonary artery dilation. The left atrial–to–aortic root ratio is increased. Aortic valve prolapse and aortic regurgitation may also be detected because of loss of support of the aortic root from the VSD, more likely with larger VSDs and VSDs with malalignment of the ascending aorta with the upper portion of the interventricular septum. Myocardial dysfunction and subsequent CHF may occur with a large VSD. Most horses with VSDs that are compatible with a normal life expectancy ultimately develop mitral regurgitation secondary to the chronic left atrial and ventricular volume overload. Continuous wave Doppler echocardiography can be used to noninvasively assess the hemodynamic significance of the shunt (see Fig. 30-5, B). A peak shunt flow velocity of 4.5 m/s or greater indicates a restrictive VSD with normal or near-normal right ventricular pressures.62 Nuclear angiocardiography can also be used to demonstrate simultaneous opacification of the left and right ventricles. The radiographic presence of cardiomegaly and increased vascularization of the lungs provide only nonspecific evidence of VSD. If polycythemia is found, a complicated VSD should be suspected.
Diseases of the Cardiovascular System

Performing the Electrocardiogram
Lead
Positive Electrode
Negative Electrode
I
Left arm
Right arm
II
Left leg
Right arm
III
Left leg
Left arm
Use of Echocardiography in Large Animals
Cardiac Catheterization in Large Animals
Blood Pressure Measurements
Horses20
Cattle21
RA
12 to 28/22 to 5 (4 to 10)
(5)
RV
30 to 59/24 to 14 (9 to 25)
42 to 56/0 to 1 (19 to 28)
PA
34 to 48/14 to 22 (16 to 30)
33 to 46/19 to 21 (24 to 31)
PAW
13/3 (8)
(5 to 21)22
LV
140 to 148/15 to 17
(120 to 144)23
AO
131 to 144/86 to 100 (110 to 115)
CA
142 to 157/98 to 119 (113 to 124)
160 to 208/110 to 147 (135 to 175)
Blood Oxygen Measurements
Cardiac Output and Ventricular Function Assessment
Angiocardiography
Nuclear Angiocardiography
Congenital Cardiovascular Disease
Ventricular Septal Defect
Definition and Etiology
Clinical Signs and Differential Diagnosis
Clinical Pathology

Diseases of the Cardiovascular System
Chapter 30