Fig. 1
Components of radiative forcing. Global mean radiative forcings (RF) and their 90 % confidence intervals in 2005 for various agents and mechanisms. Errors for CH4, N2O and halocarbons have been combined. The net anthropogenic radiative forcing and its range are also shown. Reproduced with permission from Solomon et al. (2007, FAQ 2.1, Figure 2)
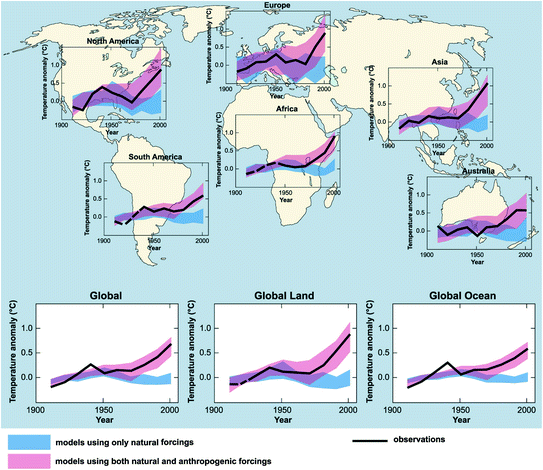
Fig. 2
Temperature changes due to natural and anthropogenic forcings. Comparison of observed continental- and global-scale changes in surface temperature with results simulated by climate models using either natural or both natural and anthropogenic forcings. Decadal averages of observations are shown for the period 1906–2005 (black line) plotted against the centre of the decade and relative to the corresponding average for the 1901–1950. Lines are dashed where spatial coverage is less than 50 %. Blue shaded bands show the 5–95 % range for 19 simulations from five climate models using only the natural forcings due to solar activity and volcanoes. Red shaded bands show the 5–95 % range for 58 simulations from 14 climate models using both natural and anthropogenic forcings. Reproduced with permission from Solomon et al. 2007, FAQ 9.2, Figure 1)
1.2 A Warming Earth: From Past to Future
Long-term climate change can be observed as a signal standing out against a background of natural climate variability (Fig. 2). To help in determining the meaning of this signal, we need historical climate data to measure natural variability. Because instrument records are available only for the recent past (not quite 150 years), previous climates must be deduced from paleoclimatic records such as tree rings, pollen series, faunal and floral abundances in deep-sea cores, isotope analyses of coral and ice cores, and diaries and other documentary evidence. Results of these analyses show that average North American temperatures in the mid- to late twentieth century appear to have been warmer than during any similar period in the last five centuries and likely the highest in at least the past 1,300 years (Solomon et al. 2007). The increasing temperature trend is accelerating rapidly. From 1906 to 2005, global average temperature rose by 0.74 °C. According to the IPCC, by 2100 health-relevant weather extremes will be very likely (Table 1). The rate of change is faster now than in any period in the last 1,000 years.
Table 1
Projected Earth system changes
Phenomenona and direction of trend | Likelihood of future trends based on projections for 21st century using SRES scenarios | Examples of major projected impacts by sector | |||
|---|---|---|---|---|---|
Agriculture, forestry and ecosystems | Water resources | Human health | Industry, settlement and society | ||
Over most land areas, warmer and fewer cold days and nights, warmer and more frequent hot days and nights | Virtually certainb | Increased yields in colder environments; decreased yields in warmer environments; increased insect outbreaks | Effects on water resources relying on snowmelt; effects on some water supplies | Reduced human mortality from decreased cold exposure | Reduced energy demand for heating; increased demand for cooling; declining air quality in cities; reduced disruption to transport due to snow, ice; effects on winter tourism |
Warm spells/heat waves. Frequency increases over most land areas | Very likely | Reduced yields in warmer regions due to heat stress; increased danger of wildfire | Increased water demand; water quality problems, e.g. algal blooms | Increased risk of heat-related mortality, especially for the elderly, chronically sick, very young and socially isolated | Reduction in quality of life for people in warm areas without appropriate housing; impacts on the elderly, very young and poor |
Heavy precipitation events. Frequency increases over most areas | Very likely | Damage to crops; soil erosion, inability to cultivate land due to waterlogging of soils | Adverse effects on quality of surface and groundwater; contamination of water supply; water scarcity may be relieved | Increased risk of deaths, injuries and infectious, respiratory and skin diseases | Disruption of settlements, commerce, transport and societies due to flooding: pressures on urban and rural infrastructures; loss of property |
Area affected by drought increases | Likely | Land degradation; lower yields/crop damage and failure; increased livestock deaths; increased risk of wildfire | More widespread water stress | Increased risk of food and water shortage; increased risk of malnutrition; increased risk of water- and food- borne diseases | Water shortage for settlements, industry and societies; reduced hydropower generation potentials; potential for population migration |
Intense tropical cyclone activity increases | Likely | Damage to crops; windthrow (uprooting) of trees; damage to coral reefs | Power outages causing disruption of public water supply | Increased risk of deaths, injuries, water- and food- borne diseases; post-traumatic stress disorders | Disruption by flood and high winds; withdrawal of risk coverage in vulnerable areas by private insurers; potential for population migrations; loss of property |
Increased incidence of extreme high sea level (excludes tsunamis)c | Likelyd | Salinisation of irrigation water, estuaries and fresh- water systems | Decreased fresh- water availability due to saltwater intrusion | Increased risk of deaths and injuries by drowning in floods; migration-related health effects | Costs of coastal protection versus costs of land-use relocation; potential for movement of populations and infrastructure; also see tropical cyclones above |
1.3 Earth System Changes
Although warming is the average effect across the Earth’s surface, changing temperatures are only part of the story. Higher temperatures evaporate soil moisture more quickly (thus severe droughts), while warm air can hold more moisture and result in heavy rains; such “hydrologic extremes” (floods and droughts) are very much a part of climate change scenarios and therefore of substantial concern to public health professionals. In addition, Arctic and Antarctic ice are melting, thereby releasing vast amounts of water into the oceans, raising their levels (from melting land-based glaciers) and potentially altering the flow of their currents. The weather patterns that result from these and other changes vary greatly from place to place, and over short periods of time, emphasize the importance of climate variability. For these reasons, the term climate change is more accurate than global warming and is the accepted term for these phenomena.
Accordingly, the accelerating temperature changes noted above have been correlated with the Earth system changes. Since 1961, sea level has risen on average by approximately 2 mm per year (Solomon et al. 2007), and snow cover and glaciers have diminished in both hemispheres. Most striking is the extent to which the Arctic ice cap has melted in the past 30 years. These trends are forecast to continue. According to the IPCC, in 90 years sea level will rise between 18 and 59 cm. Extremes of the hydrologic cycle (e.g., floods and droughts) are also expected to accompany global warming trends.
2 Impacts of Climate-Driven Environmental Change on Human Health
The relationships between human health and environmental changes due to climate change have been reviewed extensively elsewhere (McMichael et al. 2006; Patz et al. 2000, 2005) and are summarized in Fig. 3. Direct effects from a warming climate have been shown in several studies on the correlation between heat waves and excess mortality (Curriero et al. 2002). Natural disasters such as floods, droughts, and intense storms have claimed millions of lives during the past two decades, and affected many more physically, mentally, or through the loss of property or livelihoods (International Federation of Red Cross 1998). Further, the IPCC’s midrange sea level rise projections (a 40-cm rise by the 2080s) will put 200 million people at risk for a range of health problems including displacement, salt water intrusion into fresh water aquifers, or disruption of stormwater drainage and sewage disposal (IPCC 2007). Warmer temperatures are likely to affect air quality through changes in ozone concentrations, a known pulmonary irritant associated with pneumonia, chronic obstructive pulmonary disease, asthma, and premature mortality (Ebi and McGregor 2008). In addition, extensive research suggests that climate change will influence aeroallergens and related human allergic disorders through changes in pollen season (Beggs 2004; Ziska et al. 2011). Nutrition and food security will also be affected through changes in crop yields, unreliability of supplies, and impacts on prices (Battisti and Naylor 2009; Schmidhuber and Tubiello 2007).
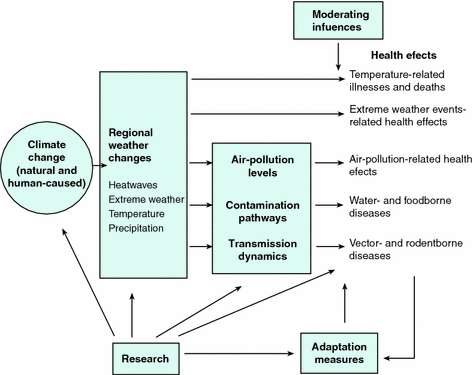

Fig. 3
Potential health impacts of climate variability and change. Moderating influences include non-climate factors that affect climate-related health outcomes, such as population growth and demographic change, standards of living, access to health care, improvements in health care, and public health infrastructure. Adaptation measures include actions to reduce risks of adverse health outcomes, such as vaccination programs, disease surveillance, monitoring, use of protective technologies (e.g., air conditioning, pesticides, water filtration/treatment), use of climate forecasts and development of weather warning systems, emergency management and disaster preparedness programs and public education. Reproduced with persmission from Patz et al. (2000)
Food- and waterborne diseases are likely to become a greater problem as climate changes. For example, flooding can contaminate drinking or recreational water with pollution from sewage lines or agricultural fields (Lipp et al. 2001; Thomas et al. 2006). Heavy rainfall can overwhelm sewage systems and treatment plants, which then discharge excess wastewater directly into surface water bodies (Patz et al. 2008).
Disease outbreaks from most waterborne pathogens are distinctly seasonal and cluster in key watersheds (Curriero et al. 2001). There is strong evidence that links incidence of waterborne outbreaks from pathogens such as Cryptosporidium (MacKenzie et al. 1994), Escherichia coli 0157:H7 (Hrudey et al. 2003), and Campylobacter jejuni (Hrudey et al. 2003) following heavy rains. Storm events of >3 inches of rainfall within 24 h can overwhelm combined sewer systems and lead to an overflow that contaminates recreational and drinking water sources (Patz et al. 2008). For example, levels of E. coli in channels leading from Milwaukee to Lake Michigan can be up to ten times higher in areas where there are no sewage overflows (Fig. 4). Climate change is anticipated to increase the frequency of these occurrences. Regional climate models, for example for the Great Lakes area of the United States, show a 50–120 % increase in sewage overflow events by the end of this century (Patz et al. 2008). This will pose increased hazards to drinking and recreational water quality. In Peru, childhood diarrheal rates increased 200 % during the 1997–1998 El Nino episode, likely due to higher survival time of diarrhea-causing pathogens in combination with an increase in warm-weather behavior such as higher demand for water and less conscientious hygiene practices (Checkley et al. 2000) (Fig. 5). The worldwide average for diarrheal diseases in the future is projected to rise 20 % for the period 2040–2069 and 29 % for 2070–2099 (Kolstad and Johansson 2011).
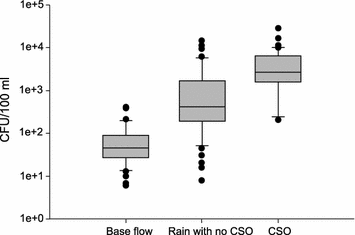
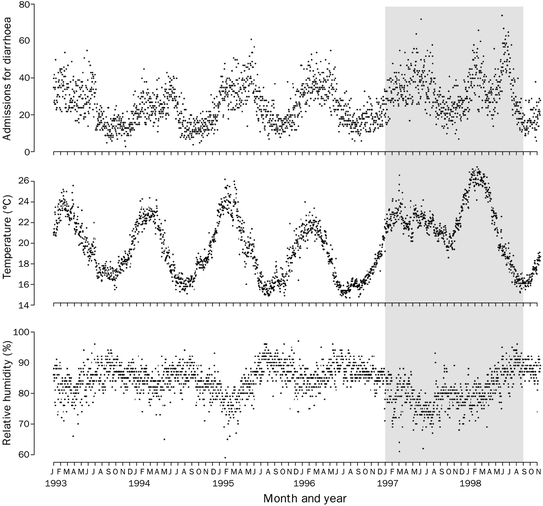

Fig. 4
Levels of E. coli in the Milwaukee Estuary and rain events in channels leading to Lake Michigan with and without combined sewer overflow (CSO) systems. Levels of E. coli in the Milwaukee estuary, which discharges to Lake Michigan, 2001–2007, during base flow (n = 46); following rain events with no CSO (n = 70); and following CSO events (n = 54). Boxes indicate 75 % of values, with median values drawn in each. Whiskers are 95 % of values and outliers are shown as closed circles. There were significant differences in E. coli levels following rainfall and CSOs compared to base flow (p ≦ 0.05). Reproduced with permission from Patz et al. (2008)

Fig. 5
Daily time series between Jan 1, 1993 and Nov 15, 1998, for admissions for diarrhoea, mean ambient temperature and relative humidity in Lima, Peru. Shaded area = 1997–98 El Niño event. Reproduced with permission from Checkley et al. (2000)
The relationship between foodborne outbreaks and temperature has been shown for several pathogens and in a variety of geographic settings (Bentham and Langford 2001; Lake et al. 2009; Zhang et al. 2007). For example, (D’Souza et al. 2004) showed that increases in salmonellosis notifications in five Australian cities were related to a rise in the mean temperature in the previous month. Heat contributed to an estimated 30 % of cases of salmonellosis in much of continental Europe, especially when temperatures exceeded a threshold of 6 °C above average (Kovats et al. 2004). A recent re-evaluation of foodborne illness over time in England and Wales confirmed the correlation with temperature in the current and previous week. The study discusses the importance of lowering pathogen loads in livestock through vaccinations of chicken flocks, limits on antibiotic use in cattle to retard development of resistant strains, and improvement of hygiene practices in abattoirs as methods to help curtail foodborne outbreaks (Lake et al. 2009).
3 Drawing Connections: Discovering the Links Between Ecological and Evolutionary Responses to Climate Change and Human Health
Research on climate change impacts on biological systems is a rich field of study with origins in the late eighteenth and early nineteenth centuries when (Bumpus 1899) documented the effects of an extreme winter storm on the selection of body size in house sparrows (Passer domesticus) and (Grinnell 1917) observed the role of temperature in defining the geographic range of many species (Parmesan 2006). More recent studies on geographic range shifts have benefited from long-term observational records of many species taken by dedicated naturalists, for example, Aldo Leopold’s observations on the timing of spring events on a Wisconsin farm (Bradley et al. 1999; Parmesan 2006). The IPCC has documented long-term studies of biologic responses to climate change on every continent (Fig. 6). Less well studied are the cascading relationships between climatic shifts, adaptation, alteration, or extinction of biota, and their resultant impacts on human health. One reason for this lack of continuity may be the dearth of multisystem, multidisciplinary research studies on climate change impacts, and the propensity to simplify complex issues by carving out small, more manageable pieces of the puzzle for investigation. Although highly detailed, system-specific information on biological impacts of climate change are necessary, integration of these biologic studies into a larger ecological web of effects will make them more relevant and useful than treating them in isolation. It is here that we begin to draw connections between species responses to climate change and human health and demonstrate areas in which biology, veterinary medicine, and public health overlap.
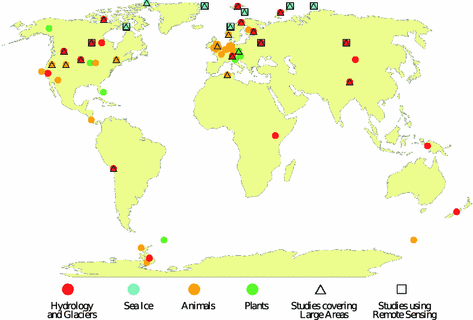

Fig. 6
Locations at which systematic long-term studies meet stringent criteria documenting recent temperature-related regional climate change impacts on physical and biological systems. Hydrology, glacial retreat and sea-ice data represent decadal to century trends. Terrestrial and marine ecosystem data represent trends of at least two decades. Remote-sensing studies cover large areas. Data are for single or multiple impacts that are consistent with known mechanisms of physical/biological system responses to observed regional temperature-related changes. For reported impacts spanning large areas, a representative location on the map was selected. Reproduced with permission from Kovats et al. (2001, Figure TS-11)
3.1 Modifications in Vector, Reservoir, and Pathogen Lifecycles
Vector-borne diseases are one of the most studied health challenges of climate change (Table 2). These are diseases that are transferred to humans or among humans by an arthropod vector. The potential relationship between climate and zoonotic diseases, that is, those that spread from animals to humans, is less well studied, although many of the same principles apply to diseases transmitted to humans from both invertebrate and vertebrate animals Mills et al. (2010). Prevailing scientific evidence suggests that there are three primary mechanisms through which climate change can affect vector-borne and zoonotic diseases: (i) geographic range shifts of vectors or reservoirs; (ii) changes in rates of development, survival, and reproduction of vectors, reservoirs, and the pathogens that they carry; and (iii) changes in biting rates of infected vectors or the prevalence of infection in reservoir or vector populations, which affects the likelihood of transmission resulting from contact with a human (Kovats et al. 2001; Mills et al. 2010; Reiter 2001). Several important vector-borne and zoonotic diseases (including their pathogen, etiologic agent, vector, and vertebrate host) that are likely to be affected by climate change are reviewed more extensively below and in Mills et al. (2010).
Table 2
Selected examples of climatic factors influencing the transmission and distribution of vector-borne diseases. Reproduced with permission from Gage et al. (2008)
Disease (Causative Agent) | Vector(s) | Relevant climatic factors | Effects of climatic variability or climate change |
|---|---|---|---|
Parasitic Vector-Borne Diseases | |||
Malaria (Plasmodium vivax, P. falciparum) | Mosquitoes | Temperature, rainfall, humidity, El Nino-related effects, sea surface temperatures | Disease distribution; pathogen development in vector; development, reproduction, activity, distribution and abundance of vectors; transmission patterns and intensity; outbreak occurrence |
Leishmaniasis (Leishmania spp.) | Sand flies | Temperature, precipitation, El Nino-related effects | Disease incidence and outbreak occurrence; abundance, behavior and distribution of vectors |
Chagas disease (Trypanosoma cruzi) | Triatomine bugs | Temperature, precipitation, humidity, severe weather event | Vector distribution, increased infestation of houses by vector |
Onchocerciasis (Onchocerca volvulus) | Black flies | Temperature | Transmission intensity |
Arboviruses | |||
Dengue fever (Dengue virus) | Mosquitoes | Temperature, precipitation | Outbreaks, mosquito breeding ,abundance, transmission intensity (extrinsic incubation period) |
Yellow fever (Yellow fever virus) | Mosquitoes | Temperature, precipitation | Outbreaks, incidence; distribution, abundance and breeding of mosquitoes, transmission intensity (extrinsic incubation period) |
Chikungunya Fever (Chikungunya virus) | Mosquitoes | Temperature, precipitation | Outbreaks; mosquito breeding and abundance, transmission intensity (extrinsic incubation period) |
West Nile virus disease (West Nile virus) | Mosquitoes | Temperature, precipitation | Transmission rates, pathogen development in vector, distribution of disease and vector |
Rift Valley Fever (Rift Valley Fever virus) | Mosquitoes | Precipitation, sea surface temperatures | Outbreaks; vector breeding and abundance transmission intensity (extrinsic incubation period) |
Ross River virus disease (Ross River Virus) | Mosquitoes | Temperature, precipitation, sea surface temperatures | Outbreaks, vector breeding and abundance, transmission intensity (extrinsic incubation period) |
Tick-borne encephalitis (Tick-borne Encephalitis virus) | Ticks | Temperature, precipitation, humidity | Vector distribution, phenology of host-seeking by vector |
Bacterial and Rickettsial Diseases | |||
Lyme borreliosis (Borrelia burgdorferi, B. garinii, B. afzelii, or other related Borrelia) | Ticks | Temperature, precipitation, humidity | Frequency of cases, phenology of host-seeking by vector, vector distribution |
Tularemia (Francisella tularensis) | Ticks | Temperature, precipitation | Case frequency and onset |
Human granulocytic anaplasmosis (Anaplasma phagocytophilum) | Ticks | Temperature, precipitation | Vector distribution, phenology of host-seeking by vector |
Human monocytic ehrlichiosis (Ehrlichia chafeensis) | Ticks | Temperature, precipitation | Phenology of host-seeking by vector |
Plague (Yersinia pestis) | Fleas | Temperature, precipitation, humidity, El Nino-related events | Development and maintenance of pathogen in vector; survival and reproduction of vectors and hosts; occurrences of historical pandemics and regional outbreaks, distribution of disease |
3.1.1 Geographic Range Shifts
A study by Rogers and Randolph (2000) modeled the predicted changes in Plasmodium falciparum malaria, the most severe form of the disease, under a range of climate scenarios used by the IPCC (HadCM2). Their study was an improvement over previous models, which had based their predictions largely on temperature and rainfall in order to highlight areas suitable for both vector and pathogen development, that is, areas where parasite development occurs rapidly enough to be completed before the vector dies, with bounds defined by habitats suitable for the mosquito. Starting with the present-day distribution of malaria, Rogers and Randolph used a statistical approach to predict disease distribution based on temperature, precipitation, and saturation vapor pressure. Under the “medium–high” scenario, they predicted that 23 million more people would be at risk for malaria by 2050. In contrast, under the “high” scenario (higher mean temperatures), they saw a decrease in exposure of 25 million people. Their findings emphasize the unpredictability of malaria incidence and the possibility of a shift in range rather than an expansion of areas suitable for malaria transmission (Ostfeld 2009).
Stay updated, free articles. Join our Telegram channel

Full access? Get Clinical Tree


