Fig. 1.
On the left, a typical ion-sensitive microelectrode is illustrated in which the barrels are closed with wax (red). The two contact wires are marked with “+” and “−” (connected to the reference and the ion-selective barrel). The tip diameter is only 3 μm. If a device with a tip diameter exceeding 25 μm is inserted into the cortex, the mechanical damage would lead to SD. On the right, ion and electron distributions of a potassium-selective microelectrode are shown. The electrode constitutes a galvanic element.
2.4 Anesthesia
Three types of anesthesia are most frequently used for in vivo studies on neurovascular coupling and spreading ischemia. In general, adequate levels of anesthesia have to be accurately controlled. This is done by continuous monitoring of blood pressure and responses to tail pinch.
Barbiturate anesthesia: Thiopental-sodium (Trapanal, BYK Pharmaceuticals, Konstanz, Germany) is a rapid-onset short-acting barbiturate. It is used at a dose of 100 mg/kg body weight intraperitoneally (i.p.). Thiopental causes cardiovascular and respiratory depression, which requires artificial ventilation and monitoring of arterial blood pressure. If required, additional lower doses of thiopental are given (e.g., 25 mg/kg i.p.).
Isoflurane/N 2 O anesthesia: Isoflurane is a halogenated ether and used for inhalation anesthesia. Isoflurane is administered via a special vaporizer in conjunction with an O2/nitrous oxide (N2O) mixture (30/70%) to promote analgesia and anesthesia. Initially, a concentration of 3–4% is used, and then reduced to ∼2% during surgery. After completion of surgery, the experiment can be performed at ∼1.5%. Isoflurane has a vasodilatatory action and changes in isoflurane concentration will result in changed baseline blood flow levels. The major advantages are that the level of anesthesia can be easily regulated, and that it can be used for long-term (survival) studies of neurovascular coupling with repeated measuring sessions (22, 23).
Alpha-chloralose: Alpha-chloralose HBC complex (C8849, Sigma Aldrich) is considered ideal for studies of neurovascular coupling (24, 25), as it preserves robust neuronal, metabolic, and hemodynamic responses to functional activation. It is not suitable for surgery due to its weak anesthetic property. Surgery and cranial window preparation have to be performed under isoflurane anesthesia. Then, alpha-chloralose (dissolved in saline, 0.5 g/ml) is started [initial slow-bolus injection of 1.6 ml/kg intravenously (i.v.)], followed by continuous infusion of ∼1.1 ml/kg i.v. per hour, and isoflurane is discontinued. A resting period of 30–60 min is required before start of the measurements to establish a stable level of anesthesia. The toxicity of the compound only allows for terminal experiments. The combination of alpha-chloralose and urethane (bolus: alpha-chloralose HBC complex and urethane: 400/200 mg/kg, followed by 400/200 mg/kg/h i.v.) achieves a better level of anesthesia and analgesia due to good analgesic properties of urethane. Sometimes, urethane is used alone (1.2 g/kg i.p.) and provides a long period of stable anesthesia and good analgesia. The major drawback is the health risk to humans as urethane has been classified as mutagen and carcinogen.
3 Procedures
3.1 General Surgery
Animal handling and general surgical procedures should be supervised and instructed by trained laboratory staff in accordance with general and national ethical guidelines for the treatment of animals in scientific research. Anesthetized animals are placed on a homeothermic blanket and equipped with a rectal temperature probe to keep body temperature at ∼37.5–38°C.
3.2 Tracheotomy
Tracheotomy is used to control and maintain stable physiology during the experiment. Adjustment of stroke volume and frequency, according to end-expiratory CO2 values, in conjunction with serial analysis of blood gases/pH enables studies on neurovascular coupling of several hours’ duration.
For tracheotomy, the animal is placed in a supine position and a ∼1.5-cm skin incision is made from the superior thorax aperture up to the level of the lower jaw after local anesthesia of the skin with lidocaine. The salivary glands are exposed and gently divided in the midline by the use of small forceps. Forceps are also used to spread the muscles covering the trachea. Thereafter, two filaments are placed for fixation of the tracheal tube around the trachea with approximately 1-cm distance between them. Care should be taken to avoid touching the jugular vein or the carotid arteries during this step since the vagus nerve accompanies these vessels and its irritation may cause increased bronchial mucus secretion and respiratory problems later on. The respirator is then switched on. Thereafter, a small incision is made below the larynx between two tracheal cartilages. The tracheal tube is now quickly inserted (Portex, polythene tubing, Smiths Medical, ID 1.67, OD 2.42) and fixated by ligatures. The tube is then connected to the respirator. The region is again treated with lidocaine solution and closed with a suture.
3.3 Vessel Cannulation
In order to monitor mean arterial blood pressure (MAP) and for intravenous application of anesthetics or specific drugs, the femoral artery and vein are cannulated. For this purpose, the leg is first gently pulled and fixed with adhesive tape before the femoral arteries and veins are exposed with an incision below and parallel to the inguinal ligament after local anesthesia with lidcoaine. The soft tissue around the vessels is carefully removed and two filaments are placed around each vessel for later fixation. The distal filament is closed with a knot and the other is gently pulled until the vessel lumen is occluded. Now, the vessel is opened by a small cut and the tip of the polyethylene tube is inserted while it is already connected to the infusion pump and filled with normal saline solution. An angular shape of the tip facilitates insertion (importantly, use a very sharp knife to cut the tip). After the catheter is secured in place by ligatures, the wounds are closed and infusion is started (0.5–1 ml/h) to keep the vessels open. In a similar fashion, the tail artery can be cannulated. Cannulation of the tail artery has the advantage that there are sufficient collaterals in the tail to compensate fully for loss of the tail artery. This allows to let the animal wake up after the procedure if this is necessary for the scientific question (e.g., for histology after ischemic stroke). The tail veins are less suitable for insertion of a catheter. To sacrifice the animal after the experiment, 20 ml of air are injected into the femoral vein.
3.4 Cranial Window Preparation
Cranial windows are an important tool for studies of neurovascular coupling (2, 26, 27). They are frequently used in combination with a variety of experimental blood flow measurement techniques. In principle, rCBF measurements can also be performed through a thinned skull preparation in which the bone is thinned to translucency. The advantages of exposing the brain are the superior optical properties, ability for direct observation of the surface vasculature, possibility for topical pharmacological interventions, and combination of rCBF measurements with microelectrode recordings (5, 28) (Fig. 2).
Fig. 2.
Schematic drawing of the rat skull with several recording devices. This open window is suitable for the use of microelectrodes. It only has an inflow to the window for the infusion of aCSF while a closed window would have an outflow on the other side in addition. Intracortical microelectrodes can be used to measure the DC-ECoG of which the upper frequency limit is determined by the sampling rate and the low-pass filter of the amplifier. Moreover, extracellular ion concentration changes can be recorded when microelectrodes are equipped with an ion-selective barrel. Ag/AgCl wire electrodes allow measurement of surface DC-ECoG, either sub- or epidurally. Laser-Doppler flow probes can be used for one-spot measurements of rCBF in a sample volume of about 1 mm3. The flow probes are placed above the cortex. The inset on the left (red arrow) shows a pial arteriole in the cranial window.
To implant a cranial window, the animal is fixed in a stereotaxic frame and a midline scalp incision is performed after local anesthesia with lidocaine. The soft tissue is removed and bleedings are stopped with bone wax. A high-speed micro drill is used to thin a circular or rectangular area of desired size at the region of interest (depending on paradigm, often up to 4 × 6 mm, record the distance from bregma). Drilling is performed under a dissection microscope and under cooling with saline or aCSF. The drilling should continue until the dural blood vessels become clearly visible and the bone flap becomes instable. An appropriate thinning is essential for safe removal of the bone flap later on. Importantly, it should be avoided to apply any pressure on the bone while drilling. When the bone flap is clearly moving during the drilling, it is ready to be removed but do not remove it now. Now, two canals are drilled for the placement of the in- and outflow tubes. A third canal can be drilled between them if you want to use a subdural electrode as described above (also compare Fig. 2). The canals are filled with bone wax after drying. Then, the in- and outflow tubes and the subdural electrode are pressed into the wax and fixed with the wax. Thereafter, a wax wall of ∼1-mm height is built around the drilled area and above the canals. The next step is to fill the cavity surrounded by the wax wall with aCSF. Subsequently, a coverslip is gently pressed on the wet wax wall to create an even top edge. This step is crucial if it is planned to close the window by a coverslip later on. For an open window, the wax wall will be a little bit higher than for a closed window to ensure an adequate aCSF level in the window later on. If you like, you can now gently connect the inflow tube with a syringe pump which eases flushing of the dural surface with aCSF during the next preparation steps (be cautious not to move the inflow tube in the canal while you are connecting it to the syringe pump). Thereafter, the bone flap is removed by pulling it carefully upwards with a forceps. While you are removing the bone flap, the dural vessels will start to bleed. Bleeding from dural vessels usually stops spontaneously. The blood is then removed by usage of a cotton swab alternating with flushing of aCSF.
All the following steps are performed under the microscope. We cauterize the dural vessels before we cut the dura. First, visualize clearly the dural arteriole that you want to cauterize. Then, dry the surface with a cotton swab (do not let the dura dry for too long). Subsequently, quickly touch the dry dura with the cauterizer at the lower rim of the window, where the dural arteriole is visible. Do not mistake a pial arteriole for a dural one. The cauterization can be a time-consuming procedure. It should be performed with great care in order to avoid any damage of the underlying cortex. After the dural arterioles are cauterized, the dura can be removed. For this purpose, a small needle tip is carefully bent which is used for cutting the dura at a small spot (under aCSF). This spot will be at the right lower corner of the window if you are right-handed and at the left lower corner if you are left-handed. Any bleeding of cortical vessels leads to exclusion of the animal from the experiment. After the initial incision, the dura is gently lifted with a fine forceps (using the left hand if you are right-handed). Then, the incision is carefully enlarged with a micro-scissor (using the right hand if you are right-handed). This is clearly the most delicate part of the preparation. If microelectrodes will be inserted, you leave the window open and should now secure the wax wall and the in- and outflow tubes with dental cement. Then, you are done with the preparation (Fig. 3).
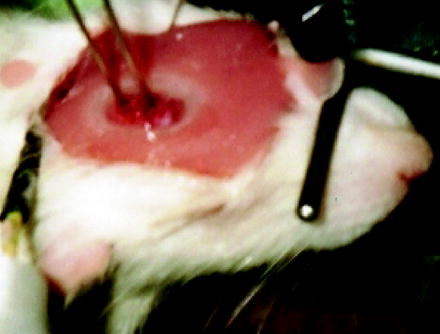
Fig. 3.
Open cranial window equipped with two laser-Doppler flowprobes, a Ag/AgCl wire electrode to measure the surface DC-ECoG, and an inflow for the infusion of aCSF into the window. Ion-selective microelectrodes are not placed yet.
If you plan to build a closed window, do not apply the dental cement yet. For a closed window, a coverslip is now cut to the desired size and gently pressed onto the wax wall while the cavity is filled with aCSF. The coverslip should be a bit larger than the wax wall. The edges of the coverslip are then secured to the wax wall with a layer of dental cement or cyanacrylate glue. However, be sure that you have carefully removed all air bubbles from the artificial subdural/subarachnoid space between brain and coverslip as well as from the inflow tube and syringe before you apply any glue or cement. Air bubbles can be very troublesome during the experiment. Avoid placing any glue on the upper side of the coverslip. Moreover, no glue or cement should enter the artificial subdural/subarachnoid space of the window. If cyanacrylate is used, a layer of dental cement should be placed around the glue after curing to secure the window and the tubes. Importantly, always give enough time for curing (once the window has a leak, it will be very hard to plug it). Thereafter, the superfusion of aCSF is started and the outflow tube has to be adjusted to an adequate level (3–7 cm height) to avoid too high or too low hydrostatic pressure (bridge veins should not be congested between brain and bone rim). If aCSF drops out of the outflow tube, you are done. Then, clean the coverslip gently, and place and connect the measuring devices.
A resting period of 30–60 min should be included before the actual measurement is started. It is recommended to test the vascular reactivity after the preparation to ensure preserved vascular reactivity. For example, this can be performed with a mild hypercapnic challenge. The experiment usually starts with recording of the baseline for another 30–60 min.
4 Cerebral Blood Flow Measurement
Hemodynamic changes in response to functional activation or SD have been studied with a variety of methodologies, including laser Doppler flowmetry (LDF), laser Doppler perfusion and laser speckle analysis imaging, direct observation of pial diameter changes, autoradiography, two-photon microscopy, analysis of optical intrinsic signals (OISs) and hemoglobin spectroscopy, and magnetic resonance imaging (MRI) or positron emission tomography (PET) scans (2, 29–36). These methods have specific advantages and disadvantages. LDF instruments have very good temporal resolution, but recordings are one-point measurements. Autoradiography has good spatial resolution, but does not follow changes over time in single subjects. Functional MRI and PET acquire depth-resolved images over time, but the spatial and temporal resolution is still limited in rodent species. Speckle and OIS techniques are able to provide two-dimensional images with good spatial and temporal resolution, but have limited depth penetration. LDF, laser speckle imaging, and optical imaging of intrinsic signals, specifically optical spectroscopy, are most frequently used methodologies, available from different manufacturers, and easily implemented into an existing in vivo setup. These methods are shortly introduced. In addition, capillary blood flow measurements by two-photon microscopy are described, which currently provide ultimate temporal and spatial resolution for studies on the cerebral microcirculation.
4.1 Laser Doppler Flowmetry
LDF offers a low-effort method for continuous noninvasive blood flow measurements in tissue. LDF measures blood flow based on the Doppler shift of coherent light induced by moving blood cells (Fig. 4). The invention of LDF has widely replaced techniques that require injection of radioactive tracers to assess rCBF. Besides noninvasiveness, the major advantage is the ability to measure perfusion changes in the microcirculation and the ability to track fast changes in flow due to its high time resolution. Major drawbacks of LDF devices are the one-point measurement and the fact that LDF instruments do not measure perfusion changes in absolute units of blood flow per unit volume of tissue. The main reason for the latter is that the sensitivity to a particular flow rate in a vessel varies with the distance of the vessel to the tip of the probe. Thus, LDF cannot be calibrated in absolute units. In addition, the nature of the method implies that the measurements are sensitive to motion artifacts. Therefore, it should be avoided to place vibrating instruments (e.g., perfusion pumps) close to the measuring site or fibers. Dislocation of the probe results in a change of baseline readings and should be prevented by positioning of the probe with a suitable micromanipulator. LDF shows a trend to overestimate flow changes at very high rCBF values and large surface vessels should be avoided when the probe is placed.
Fig. 4.
LDF measures blood flow based on the Doppler shift (blue) of coherent light induced by moving blood cells.
LDF has been extensively reviewed (37, 38). The standard laser Doppler perfusion monitor uses fiber-optic probes with one fiber delivering the laser light from the laser diode to the tissue and another fiber to detect and deliver the backscattered photons to the photodetector. The interference of Doppler-shifted with non-Doppler-shifted light produces a dynamic speckle pattern that causes fluctuations of the photodetector’s current. The power spectrum of the current fluctuations is then analyzed to extract flux and concentration of moving blood cells. rCBF is expressed in arbitrary units. The LDF records integrated perfusion in the sampling volume. The precise measurement depth and sampling volume depend on the fiber separation and wavelength of the laser. The probes used for rCBF measurements typically have a fiber separation of 0.25 mm and a 780-nm wavelength. It is assumed that rCBF is measured in a volume of ∼1 mm3 with such a configuration; the measuring depth is ∼1 mm. LDF is a reliable method to record relative rCBF changes in the brain, usually expressed as changes compared to baseline under control conditions (29, 39–41). To achieve a certain degree of depth resolution of cortical perfusion changes, combined fiber probes can be used with different fiber separations and different wavelengths. This enabled analysis of rCBF changes with a 200–300-μm spatial depth resolution and has been used for laminar analysis of rCBF changes in response to functional activation and SD (42–44). Laser Doppler perfusion measurements are easy to handle and commercially available from a number of manufacturers, like Perimed AB, Järfalla, Sweden; Moor Instruments, Axminster, Devon, UK; LEA Medizintechnik, Giessen, Germany; and Oxford Optronix Ltd., Oxford, UK.
4.2 Laser Speckle Contrast Analysis
By means of laser speckle contrast analysis (LASCA), two-dimensional maps of cortical rCBF can be obtained with good spatial and temporal resolution (33, 45). Laser speckle is a random interference pattern produced by the coherent addition of scattered laser light with slightly different path lengths. A granular or speckle pattern is generated when an area illuminated by laser light is imaged onto a camera. A time-varying speckle pattern is produced at each pixel in the image if the scattering particles are in motion. The variations of this pattern contain information about the motion of the scattering particles and quantitative (relative) flow information is obtained through measuring the temporal and spatial intensity fluctuations of the speckles and conversion of the raw speckle images by specific analysis algorithms into two-dimensional blood flow maps (33, 37). As such, LASCA is not based on a spectral analysis of scattered laser light like LDF but images and evaluates the spatial changes of speckle fluctuations. It has been used to evaluate rCBF changes in response to functional activation, SD, and ischemia in cranial window preparations or through the thinned skull (34, 46–49). An important advantage over LDF is the ability for two-dimensional monitoring of rCBF changes (Fig. 5). The possibility to combine speckle imaging with fluorescence imaging or optical spectroscopy (50, 51) offers the option for multiparameter brain imaging. Like LDF, LASCA does not allow quantification of rCBF in absolute units. Another limitation comes from the fact that the signal is dominated by superficial flow changes and gives limited information on changes in deeper cortical layers.
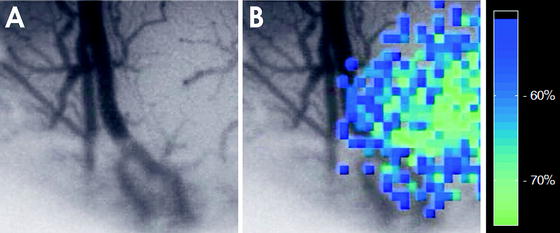
Fig. 5.
LASCA image of focal ischemia. (a) The upper image gives a conventional surface picture. Note the virtual disappearance of pial arterioles on the right side of the picture due to focal vasospasm in the microcirculation. (b) The pseudo-colored image shows the rCBF reduction in the cortex on the right side.
4.3 Optical Imaging of Intrinsic Signals and Optical Spectroscopy
Optical imaging methods are frequently used for studies of neurovascular coupling. The general assessment of reflectance changes as a wave of SD passes to a brain slice is described in Chap. 29. This allows easy identification of localization, spread, and speed of SD waves. OIS is also widely used in the blood-perfused brain and the general principle is based on the correlation of changes in light reflectance with changes in neuronal activity due to changes in blood volume, hemoglobin concentration, cytochrome oxidation, and light scattering (34, 52–56). Hemoglobin is the main tissue absorber of light of visible wavelength and oxy- and deoxyhemoglobin have specific absorption spectra which differ and are used to calculate concentration changes in oxy- and deoxygenated hemoglobin. This enables to follow hemodynamic changes in response to changes in neuronal activity. The wavelength and algorithm chosen to calculate the changes in oxy- and deoxyhemoglobin can have profound effects on the conclusions that are drawn (54, 57–60). Optical spectroscopy systems use white light sources with fiber probes or slit spectrography to measure changes in a single location (58, 61, 62). Extension to these models was introduced when CCD cameras were used in combination with filter wheels to illuminate a large region of the cortex. This allows the assessment of temporal and spatial characteristics of changes in oxy- and deoxyhemoglobin in response to SD or functional activation (34, 56, 63, 64). Optical imaging spectroscopy also provides information on relative changes in oxygen consumption when measurements are combined with concurrent measures of rCBF change (50, 62, 65). The rapid technical improvements in the field of optical imaging and related techniques, like depth-resolved imaging (66), will make them powerful tools to investigate the mechanisms and pathology of neurovascular coupling.
4.4 Two-Photon Imaging of rCBF
The ability to image rCBF dynamically in the living brain through a cranial window has greatly improved our understanding on rCBF regulation. Imaging techniques described above examine rCBF changes in larger areas of the cortex, have limited spatial resolution, and are often restricted by limited penetration depth. With introduction of confocal microscopy into studies on brain blood flow regulation, it became possible to image the cerebral vasculature in three dimensions in the intact brain of living rodents and to analyze perfusion changes at the capillary level (67, 68). The adoption of the capillary blood flow measurement technique for two-photon microscopy increased penetration depth and allowed for direct observation of capillary-level perfusion in deeper cortical layers (20, 69–71). It is currently the technique which provides the highest time and spatial resolution of blood flow and has become increasingly important for studies on neurovascular coupling, brain ischemia, and SD (20, 70, 72–75).
< div class='tao-gold-member'>
Only gold members can continue reading. Log In or Register to continue
Stay updated, free articles. Join our Telegram channel

Full access? Get Clinical Tree


