Fig. 1.
Arteriograph chamber for intact pressurized cerebral arteries. (a) Overhead view of 5 ml arteriograph chamber used for cannulation of cerebral artery segments. (b) Glass micropipettes are pulled from capillary tubes and mounted in an arteriograph chamber. (c) Image of a rat posterior cerebral artery (∼150 μm diameter) cannulated on glass micropipettes. Suture thread is used to tie each end of the artery segment onto the micropipettes. (d) Image of rat parenchymal arteriole (∼60 μm diameter). Video edge detection (black horizontal lines) is used for measurement of arterial diameter.
Fine-tipped forceps (Fine Science Tools)
Cell-permeant fura-2AM (Invitrogen)
Calcium and diameter recording system (e.g., IonOptix Inc.):
Hyperswitch light source
Xenon arc lamp
IonWizard-Core and Analysis Soft Edge software
Fluorescence system interface
Myocam-S digital CCD video camera
Photomultiplier tube (PMT) subsystem
Dichroic mirror
Photon-to-voltage converter
Inverted fluorescence microscope
20×/0.50 NA objective lens
Peristaltic pump (Ismatec Inc.)
PS-200 pressure servo controller with peristaltic pump (Living Systems Instrumentation)
Dark room/red light
2.3 Procedures
2.3.1 Tissue Preparation and Dye Loading
Cerebral arteries and arterioles (50–200 μm in diameter) are dissected from the brain and kept in ice-cold artificial cerebral spinal fluid (aCSF) of the following composition (in mM): 125 NaCl, 3 KCl, 18 NaHCO3, 1.25 NaH2PO4, 1 MgCl2, 2 CaCl2, 5 glucose aerated with 5% CO2, 20% O2, 75% N2 (pH, 7.30–7.35). Freshly isolated cerebral artery segments are cannulated on glass micropipettes mounted in a 5 ml myograph chamber (Fig. 1) (18). Following cannulation, blood vessels are incubated with previously aerated aCSF containing fura-2AM (acetoxymethyl ester membrane-permeable form; 5 μM; Invitrogen, Carlsbad, CA) and pluronic acid (0.1%; Invitrogen) at room temperature (∼22°C) for 45 min in the dark. The myograph chamber is then mounted on an inverted fluorescence microscope and arteries are pressurized and continuously superfused with aCSF (37°C, 30 min) to allow equilibration and deesterification of fura-2.
It has previously been demonstrated that Ca2+ can be selectively measured in vascular smooth muscle or endothelium by loading fura-2 from the extraluminal or luminal side of the vessel, respectively (19). However, the specific loading time and dye concentration described above may need to be slightly adjusted based on the specific tissue studied to enable sufficient permeation of dye into smooth muscle while avoiding loading of the dye into the endothelium. To examine whether dye loading is smooth muscle-specific, studies can be performed on arteries in which the endothelium is physically removed by luminal passage of an air bubble (2). Endothelial removal can be confirmed by lack of response to endothelium-specific pharmacological agents (e.g., acetylcholine, bradykinin, NS309) (20, 21).
2.3.2 Data Acquisition and Estimation of Intracellular Ca2+
First, an aperture located adjacent to the dichroic mirror is adjusted so that the blood vessel completely fills the rectangular field of view in the data acquisition software. This minimizes the contribution of extraneous light to the fluorescence signal. The dichroic mirror reflects fluorescence emission to the PMT while the use of a red filter in the microscope condenser allows the vessel image to be transmitted to the CCD camera. Thus, the image collected by the CCD camera for diameter measurement represents the same field from which fluorescence is detected by the PMT.
Following equilibration, fluorescence ratio (F 340:F 380) is obtained from background-corrected 510 nm emission from arteries alternately excited at 340 and 380 nm (Fig. 2) using software developed by IonOptix (Milton, MA). Arterial wall [Ca2+] is estimated using the following equation: (17) ![$$\left[{\text{Ca}}^{2+}\right]={K}_{\text{d}}\times \beta \times (R-{R}_{\mathrm{min}})/({R}_{\mathrm{max}}-R).$$](/wp-content/uploads/2016/07/A194894_1_En_44_Chapter_IEq1.gif)
Fig. 2.
Simultaneous measurement of global [Ca2+]i and diameter of an intact pressurized cerebral artery. Fluorescence intensity (photomultiplier tube counts) at 340 and 380 nm excitation (F 340 and F 380, respectively), F 340/F 380 ratio, calculated free [Ca2+]i and arterial diameter from a pressurized rabbit cerebellar artery. Smooth muscle membrane potential depolarization induced by elevating extracellular K+ from 3 to 60 mM caused an increase in F 340/F 380 ratio (i.e. increased free [Ca2+]i) and vasoconstriction. The response to 60 mM K+ was reversed by application of the VDCC blocker nifedipine (1 μM).
R min and R max values represent the ratios of emission signal under Ca2+-free and Ca2+-saturated conditions, respectively. To obtain these values, arteries are first loaded with fura-2 and equilibrated as described above. Arteries are then perfused (10 min, 37°C) with a baseline solution containing the following (in mM): 5 NaCl, 140 KCl, 5 HEPES, and 1 MgCl2 (pH 7.4). Next, to obtain R min, arteries are perfused (30 min) with baseline solution that includes EGTA (5 mM), ionomycin (10 μM), and nigericin (5 μM). Recording at the end of this period allows determination of R min. EGTA is then washed from the bath by perfusion of baseline solution for 15 min. To obtain R max, arteries are then perfused (15 min) with baseline solution containing CaCl2 (10 mM), ionomycin (10 μM), and nigericin (5 μM) for 10 min. The ratio of calcium-free over calcium-bound fluorescence intensities at F 380 (β) is determined from these values. In our studies, we have used an apparent dissociation constant (K d) of 282 nM of fura-2 for Ca2+ determined by Knot and Nelson (2) using rat cerebral arteries.
2.3.3 Measurement of Arterial Diameter
Luminal diameter is simultaneously recorded throughout the entire experiment using a CCD camera and the length-calibrated video edge detection function of IonOptix software (Figs. 1d and 2). Constriction is analyzed as the decrease in arterial diameter relative to the passive diameter using the following equation (22):
 where DP is the passive (fully dilated) diameter of the artery in Ca2+-free aCSF containing a VDCC blocker (e.g., 100 μM diltiazem or 300 nM nifedipine) and a second vasodilator, such as forskolin (1 μM) and DA is the active diameter of the artery in response to the stimulus in aCSF. Percent dilation can be obtained using the following formula (22):
 where DV is the arterial diameter in the presence of vasodilator, DA is the active arterial diameter before application of vasodilator, and DP is the passive arterial diameter.
2.3.4 Variations in Measurement of Global [Ca2+]i
Most investigators obtain ratiometric measurements of fura-2 in isolated arterial segments or dissociated cerebral artery myocytes by collecting emitted photons using a PMT. Fluorescence detection may also be achieved using electron multiplying CCD or intensified CCD cameras along with quantitative ratio imaging software for analysis and estimation of intracellular Ca2+ (2). However, high sensitivity cameras required for these measurements are expensive and do not offer significant spatial information when used with wide-field microscopy. In cases where an investigator wishes to measure fura-2 fluorescence in a specific layer of the vascular wall (smooth muscle or endothelium), fluorescent imaging over photometric methods may be advantageous.
3 The Use of Fluo-4 to Measure Ca2+ Sparks in Cerebral Artery Myocytes
3.1 Background
Single-wavelength Ca2+ indicators, such as fluo-4, or its analogue fluo-3, have become widely used for imaging of fast, small volume Ca2+ signaling events, such as Ca2+ sparks (23). One advantage of fluo-4 over ratiometric indicators (e.g., fura-2) in the measurement subcellular Ca2+ signaling events is superior signal-to-noise ratio. Fluo-4 is excited at 488 nm and exhibits increased fluorescence intensity (>100-fold) upon binding Ca2+ without a shift in absorption or emission spectra (24). Moreover, fluo-4 has a lower affinity for Ca2+ than fura-2 (K d = 400 nM compared with K d = 282 nM for fura-2) and fast binding and unbinding kinetics, making it suitable for tracking rapid Ca2+ signaling events (24). Ca2+ sparks can be measured using a number of imaging approaches, including single photon and multiphoton confocal microscopy, total internal reflection fluorescence (TIRF) microscopy, and wide-field microscopy using low-noise CCD cameras (23).
Previously, the temporal resolution of laser-scanning confocal microscope systems sufficient to measure Ca2+ sparks could only be achieved using line-scan mode, as opposed to two-dimensional (2D) x–y image scanning (5). However, the interpretation of images obtained using line-scanning is complicated by uncertainties in the position of the scan line with regard to the center of the Ca2+ release event resulting in a loss of spatial information, such as accurate determination of Ca2+ spark area. Another disadvantage of this method is the inability to measure the total number of active spark sites within a cell. Currently, a number of laser-scanning confocal microscope systems with sufficient 2D sampling frequency (>30 Hz) are available. The following section provides a detailed description of protocols that we have used to measure Ca2+ sparks in cerebral artery myocytes using fluo-4 and 2D laser-scanning confocal microscopy.
3.2 Materials and Instruments
Cell chamber with glass coverslip bottom
Cell-permeant fluo-4AM (Invitrogen)
Laser scanning confocal system (e.g., Oz, Noran Instruments)
Inverted fluorescence microscope (Nikon Diaphot)
60×/1.2 NA water-immersion objective lens
Krypton/argon laser (480 nm is used to excite fluo-4)
Dark room
3.3 Procedures
3.3.1 Isolation of Cerebral artery Myocytes
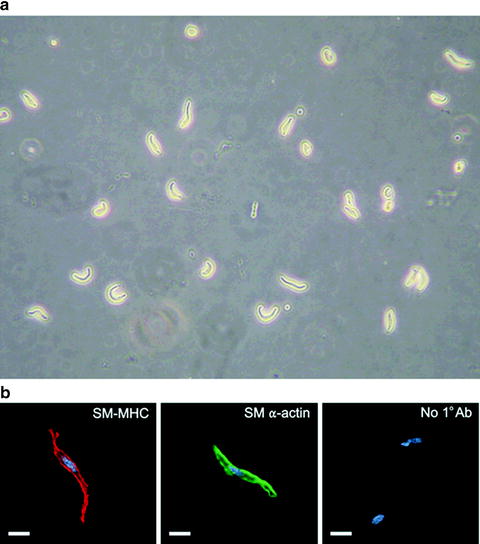
Cerebral arteries are enzymatically dissociated to obtain individual smooth muscle cells (Fig. 3) (25). After dissection, cerebral arteries are incubated in a glutamate-containing isolation solution (GIS) of the following composition (in mM): 55 NaCl, 5.6 KCl, 80 l-glutamic acid (mono-sodium salt), 2.0 MgCl2, 2 CaCl2, 10 HEPES, and 10 glucose (pH 7.3; 37°C; 30 min) using a 1 ml vial placed in a water bath. Arteries are then transferred to a Ca2+-free GIS containing papein (0.3 mg/ml) and 1,4-dithioerythriol (0.7 mg/ml; 37°C; 17 min) using a fire-polished Pasteur pipette. Next, arteries are incubated in GIS containing collagenase type F (0.7 mg/ml), collagenase type H (0.3 mg/ml), and 100 μM CaCl2 (37°C; 20 min). Finally, arteries are incubated in GIS containing 2 mM CaCl2 on ice (3×; 10 min) and gently triturated into individual cerebral artery myocytes using a small bore fire-polished Pasteur pipette. Cerebral artery myocytes can easily be identified by characteristic spindle-shaped morphology (Fig. 3). The cells are kept on ice and used within 6 h of isolation.
 < div class='tao-gold-member'>


Only gold members can continue reading. Log In or Register to continue
Stay updated, free articles. Join our Telegram channel
Full access? Get Clinical Tree
