CHAPTER 5 Aspects of Clinical Nutrition
Veterinarians are a primary source of nutritional information and advice for horse owners. Therefore it is reasonable to expect equine practitioners to have some expertise in the clinical assessment of nutritional status and feeding programs so that they may assist horse owners in the selection of rations for an individual horse or group of horses. Additionally, because diet composition can contribute to the pathophysiology and clinical manifestations of certain chronic diseases (e.g., some forms of chronic exertional rhabdomyolysis), the veterinarian is often consulted to make recommendations for special diets. Special dietary considerations are also required for sick neonatal foals or adult horses. This chapter provides an overview of the principles of clinical assessment of nutritional status and feeding programs, reviews carbohydrate nutrition for horses (including the types of carbohydrates in horse feeds, terminology and methods for analysis of carbohydrates in feeds, and strategies for mitigation of gastrointestinal disturbances associated with carbohydrate nutrition), and summarizes current recommendations for the nutritional support of neonatal or adult horses with acute illness. Other topics are feeding management of thin and starved horses and dietary recommendations for the management of obesity, which is becoming a significant problem in equine medicine. The reader is referred to the most recent edition of the National Research Council’s Nutrient Requirements of Horses for a complete discussion of equine nutrition.1
EVALUATION OF NUTRITIONAL STATUS AND FEEDING PROGRAMS
Clinical assessment of a feeding program for an individual or group of horses involves three basic elements: assessment of general health and dietary history, clinical examination, and evaluation of current diet and feeding method (i.e., types and amounts of feeds and how they are fed). The physiologic state and intended use of the horse (e.g., pregnant, lactating, in athletic work) affect its nutritional requirements and therefore are vital with respect to the evaluation of the feeding program and the making of any necessary adjustments. It also is useful to inspect housing and feeding facilities, including feed bins, hay storage, and the watering system. Commercial software programs are available to assist with ration evaluation in relation to nutrient requirements.2 Figure 5-1 shows an example of a simple form that can be used to collect clinical data, including signalment, body weight and condition, and details regarding the horse’s current and recommended ration. Box 5-1 provides explanations for a number of nutritional terms used to describe feed nutrients and fractions, the knowledge of which is relevant to the interpretation of feed analysis data.
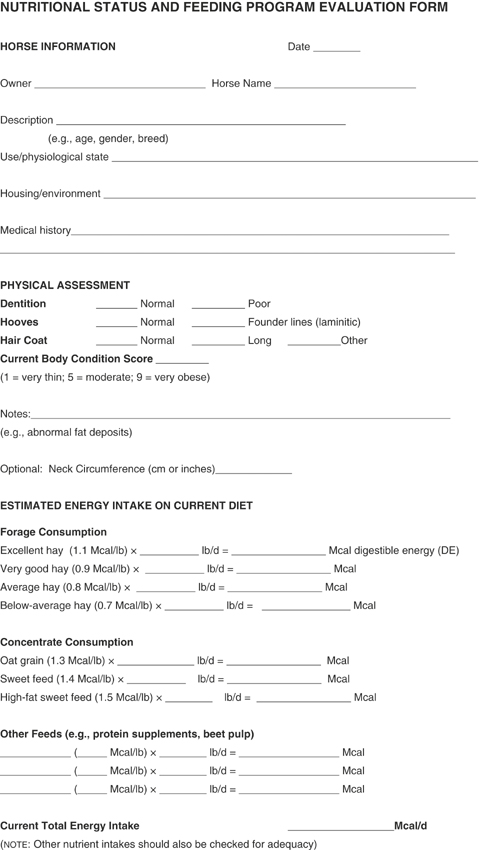
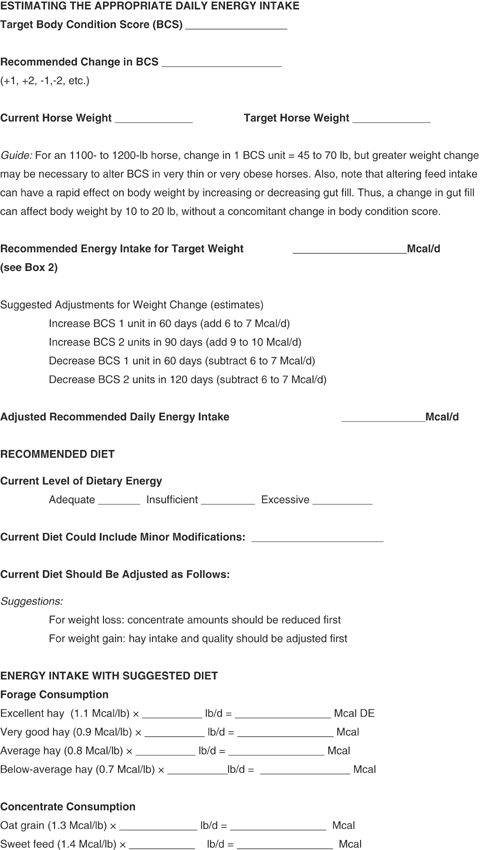
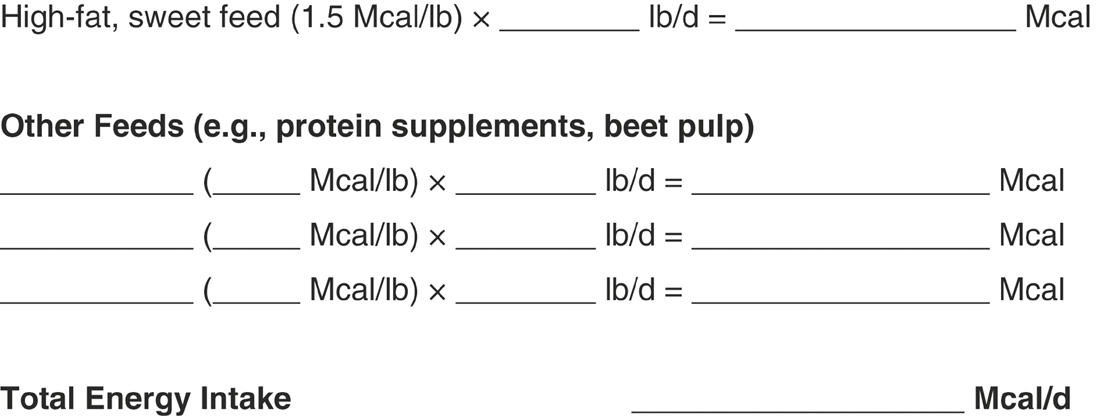
FIGURE 5-1 Worksheet for evaluation of nutritional status and feeding program
(adapted from Dr. Laurie Lawrence, University of Kentucky).
BOX 5-1 NUTRITIONAL TERMINOLOGY RELEVANT TO THE INTERPRETATION OF FEED COMPOSITION DATA
Moisture: % of feed that is water
Dry matter: 100% minus the water in feed
Most hays and concentrates are approximately 90% water.
Fresh pasture can contain 60%-80% water.
Crude protein (CP): Also called total protein; this value is calculated by measuring total nitrogen.
Clinical Examination
Body weight and BCS, which assesses subcutaneous fat deposition, are indicators of long-term energy balance: energy (calorie) intake relative to the horse’s needs. In general, horses that receive inadequate dietary energy will lose body weight and condition, whereas weight gain and the development of overconditioning (high BCS) signify energy intake in excess of requirements. Although a number of systems have been used to determine BCS, the most widely applied method is that developed by Henneke.3 The Henneke system uses a 1- to 9-point scale and requires the assessment of subcutaneous fat deposition in six areas: over the crest of the neck, withers, behind the shoulder, over the ribs, along the back, and around the tail-head. Considerable variation may exist in the pattern of fat deposition among horses; for example, some horses have little fat deposited over the ribs even when other areas of the body are well covered. In addition, fat deposits are sometimes asymmetrically distributed. Therefore it is important to evaluate all six areas of the body on both sides. A score between 1 and 9 is assigned, wherein 1 indicates severe emaciation and 9 indicates extreme fatness (Table 5-1). Body condition scores of 4 to 6 are regarded as ideal depending on use of the horse. Studies of weight gain and loss in moderately conditioned (BCS = 4-7) Thoroughbred, Quarter Horse, and Arabian horses indicate that one BCS unit represents approximately 25 to 35 kg of body weight.4,5 The body weight associated with each unit of body condition may be higher in fat or thin horses.
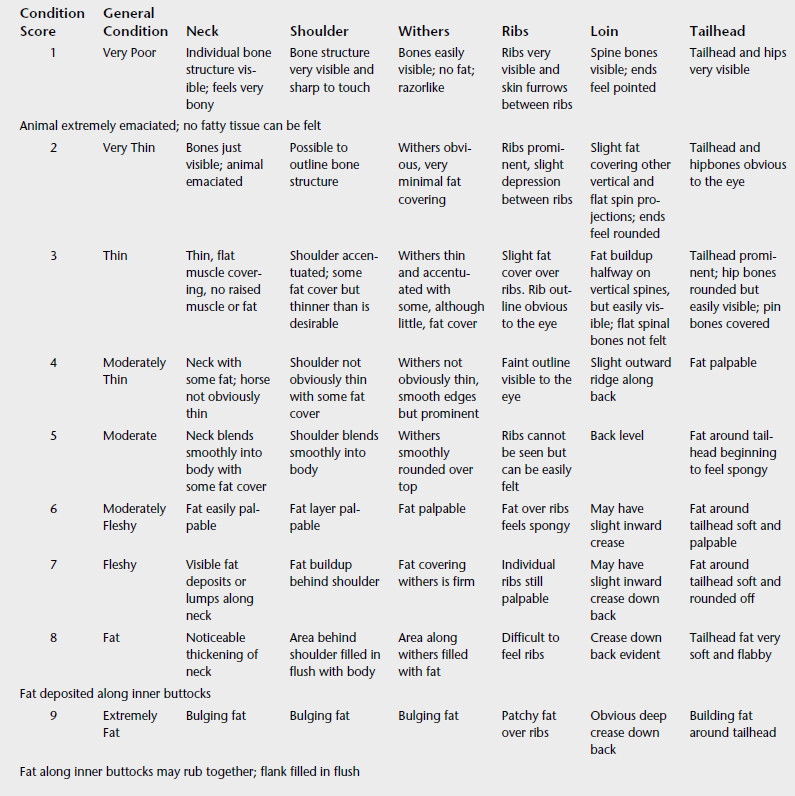
The Henneke BCS system, originally developed for use in Quarter Horse broodmares,3 is most appropriate for use in light breeds such as Thoroughbreds, Arabians, and Standardbreds. This system may not be suitable for ponies and larger-breed horses (e.g., drafts) that have a different pattern of fat distribution. A 9-point BCS system for Warmblood horses was developed to account for differences in conformation and patterns of fat deposition in this breed when compared with Quarter Horses.6 For example, fat begins to cover the hip bones of Quarter Horses at a BCS of 4, whereas the hip bones of Warmblood horses remain prominent at a BCS of 6 (using the system developed for Warmbloods).
It also should be noted that the BCS system does not register differences in regional adiposity that may signify increased risk of disease. In humans visceral (abdominal) adiposity is more closely linked than generalized obesity to the risk for diabetes and cardiovascular disease, and measurement of waist circumference is a better indicator of abdominal fat accumulation than is body mass index.7 In horses and ponies there may be a similar association between regional adiposity and disease risk. In studies of horses and ponies with a predisposition to pasture-associated laminitis, some affected animals are not obese on the basis of BCS (i.e., BCS <7) and have no external evidence of regional adiposity, but others have enlarged fat deposits on the neck (“cresty neck”) and thoracic and tailhead regions; these fat deposits are sometimes asymmetrically distributed.8,9 Neck crest adiposity, assessed by the ratio of mean neck circumference to height at the withers (NCHR), is negatively associated with insulin sensitivity in horses and ponies.9,10 Although cutoff values for NCHR in relation to obesity and disease risk have not been defined, repeated measurement of mean neck circumference is useful for monitoring the effectiveness of a weight loss program.
Knowledge of a horse’s body weight is needed for accurate calculation of nutrient and feed requirements. It is important to note that the body weight of an individual horse can vary between 5% to 15% depending on hydration and feeding status and on gastrointestinal fill. Accordingly, it is important to standardize the time of feeding relative to measurement of body weight. Body weight may be measured directly by use of a platform scale or, in mature horses, estimated from body measurements such as heart girth circumference and body length.11,12 Heart girth is measured immediately behind the elbows, and body length is measured from the point of the shoulder to the tuber ischii:

Body weight also can be estimated from measurement of heart girth circumference by use of a weight tape calibrated for horses. Measurements should be taken in a consistent manner, with the horse standing on a flat surface, and care must be taken not to pull the tape too tightly. Clinicians are advised to take the average of several (e.g., 3 or 4) measurements. Accuracy of these measurements is affected by a number of factors, including breed, conformation, level of fitness, thickness of hair coat, gastrointestinal fill, and pregnancy status.12 Body weight based on heart girth is most accurate when this method is applied to mature horses with an average BCS (i.e., 5-7). Underestimation or overestimation of body weight may occur when weight tapes are used to estimate the body weight of horses with low or high condition scores.
Diet and Ration Evaluation
It is useful to first examine the physical characteristics of feeds (i.e., visual appearance [color, presence of foreign material such as mold and dust] and odor). Preserved forages (e.g., hay) should be evaluated for type (grass versus legume), leaf -to-stem ratio, and presence of seed heads. Hays with good nutritional value are characterized by a large proportion of leaf; when compared with stems, leaves have higher nonstructural carbohydrates (starches, sugars, fructans), lower structural carbohydrates (hemicellulose, cellulose, lignin), and higher protein.1 Therefore second- and third-cutting hays, which often have a higher stem-to-leaf ratio, tend to provide higher nutritional value than first-cutting hay. The latter is usually harvested at a more mature stage. The presence of seed heads and a stemmy, coarse appearance are also indications of advanced maturity at cutting. Some studies have reported an inverse relationship between the neutral detergent fiber (NDF, the fraction that contains cellulose, hemicellulose, and lignin) and voluntary hay intake (i.e., the voluntary intake of stemmy hays with high NDF content will be lower compared with that of hays with high leaf-to-stem ratio).1,13
The next step in the evaluation is to estimate daily feed intake. Owners or stable managers should be questioned to determine the amounts of hay, concentrates, and supplements provided (and whether the horse regularly refuses any of these feedstuffs). All feeds, including several flakes or biscuits of hay, should be weighed to estimate the actual amounts of feed provided to the horse. Significant errors may occur when volume (e.g., “a coffee can full”) rather than weight is used to estimate feed provision because grains, concentrates, and hays vary markedly in weight per unit volume. A handheld fish scale or similar scale works well for this task. It is difficult to measure actual feed intake, particularly when forage is fed on the ground, where wastage can be as high as 25%, or fed to groups of horses. The other challenge is estimation of pasture forage intake, which is generally taken as the difference between the mean intake of digestible energy (DE) for horses, with consideration given to their weight, age, and physiologic condition, minus actual daily intakes of hay and grains. As previously mentioned, regular assessment of body weight and BCS over time will provide the best guide to the adequacy of energy intake. Reported values for daily dry matter intake (DMI) by horses, ponies, and donkeys range between 0.8% to 5.2% of body weight.1 Young and mature horses appear to have a maximal daily DMI of 3% to 3.2% of body weight, but intakes in the range of 2.0% to 2.5% of body weight are more typical (this includes horses maintained on an all-hay diet). Some evidence suggests that ponies may have higher daily DMI than horses.1
The clinician also should evaluate feeding management, particularly when a problem under investigation may be due to poor feeding practices (e.g., weight loss, colic). For example, what are the relative proportions of forage and grain/concentrate? Does the ration contain adequate high-quality forage? How many times a day is the horse fed? How frequently is the diet changed, and are these changes made gradually (ideally over 7 to 10 days) or suddenly? Several epidemiologic studies have reported that changes in diet (grain/concentrate or hay, even when switching to hay of the same type) significantly increase the risk of colic.14–16 The risk of gastrointestinal problems also increases when horses are fed large quantities of starch-rich grain and concentrate feeds or inadequate long-stem roughage.14,16 As a general guide, all horses should receive a minimum of 1.0% of body weight per day as hay or the equivalent; forage at 1.5% of body weight per day is preferred. For a 450- to 500-kg horse, grain or concentrate meals should be no more than 2.5 kg (approximately 5 lb) to reduce risk of hindgut disturbances associated with the cecal delivery of undigested starch. If the daily ration includes more than 5.0 kg of grain or concentrate, it should be provided in more than two feedings per day (see the section on carbohydrates in equine nutrition).16
Information on the nutrient content of the diet is needed to determine the adequacy of the ration. Several approaches can be used to estimate the nutrient contents of feeds. The feed tags on commercial feeds provide some nutritional information, including a list of ingredients and data on some nutrients. However, feed manufacturers are required to guarantee only that minimums were met and maximums were not exceeded; in other words, the actual content of listed nutrients is not provided. An alternative source of data on the nutrient content of feeds is published databases (e.g., National Research Council [NRC] publications, feed company Web sites). Although the nutrient profiles available from these databases provide a useful guide, these data may not correspond exactly to the feedstuff provided to the horse under evaluation because of differences in geography, growing and harvesting conditions, and other factors. The ideal, although not always practical, approach is to submit samples of feed and forages (core hay samples, pasture clippings) for laboratory analysis of nutrient content. At least two samples (approximately 250 g each) of each grain or concentrate should be taken; these should be mixed thoroughly with the composite sample submitted for analysis. Approximately 10% of the hay store should be sampled by use of a hay probe. Again, these samples should be well mixed, with the composite sample shipped to the laboratory in a sealable plastic bag. Garden shears can be used to obtain pasture clippings, which should be sampled in a Z pattern and cut to grazing height. It may be necessary to sample clippings taken from several pastures to determine the range of nutrients on the farm. The basic nutrient profile from analysis includes dry matter (DM), DE, crude protein (CP), acid detergent fiber (ADF), NDF, fat (EE, ether extract), ash, calcium, magnesium, phosphorus, sodium, and potassium (see Box 5-1). Trace element and vitamin analyses are available depending on need and expense. Some laboratories will perform additional analyses and calculations to provide estimates of some of the carbohydrate fractions. For example, Equi-Analytical Inc. (Ithaca, NY; www.equi-analytical.com) analyzes starch and ethanol-soluble carbohydrates (which are mostly simple sugars). More information on dietary carbohydrates is presented later in this chapter.
With data on feed composition (and estimated intake of feeds), it is possible to formally evaluate the ration against published feeding standards (e.g., NRC 20071). The NRC developed a simple Web-based program that calculates nutrient requirements derived from the 2007 Nutrient Requirements of Horses (http://nrc88.nas.edu/nrh/); this program can also be downloaded to a personal computer. The user is first required to enter basic information such as age, body weight, and physiologic state (e.g., stallion, lactating mare, working horse) and then data on the horse’s ration—specifically, the amount and nutrient profile of each feed and supplement fed to the horse. The program uses these data to calculate nutrient requirements, dietary supply, and the difference between the two amounts. Unfortunately, only a limited number of nutrients are evaluated: DE, CP, lysine, Ca, P, Na, Cl, and K. The NRC recommendations are also based on minimum nutrient requirements, whereas many nutritionists favor feeding standards based on optimal ranges. Several nutrition companies have developed more comprehensive computer software programs. For example, Microsteed, developed by Kentucky Equine Research (KER), Inc., can evaluate the ration against both the NRC minimums and a set of optimums recommended by company nutritionists.17
The process outlined in the preceding paragraphs will facilitate decisions regarding the adequacy of the current ration. If gross deficiencies or excesses are identified, adjustments can be recommended and implemented. Another important aspect is the need for follow-up monitoring, particularly if a goal has been set for weight loss or gain. Figure 5-1 outlines a simple way to estimate energy needs and intake and calculate ration adjustments necessary to facilitate weight loss or gain. A more detailed discussion of dietary management of thin or obese horses is presented later in this chapter.
CARBOHYDRATES IN EQUINE NUTRITION
Carbohydrates are the primary source of energy in the diet of horses. As nonruminant herbivores, horses evolved to utilize forages high in structural carbohydrates, with bacterial fermentation and production of volatile fatty acids (VFAs) in a highly developed large intestine. However, modern horses, particularly those in athletic training, are often fed cereal grains or other starch-rich feeds to meet energy requirements. For example, some survey studies indicate that racehorses weighing 450 to 550 kg typically receive 3 to 6 kg of feed per day, with some horses receiving more than 8 kg per day.18,19 Such high grain intakes by horses (or a low forage-to-grain ratio such as 30:70) have been implicated in the development of gastrointestinal problems, particularly colic associated with disturbances to hindgut function20,21 and gastric ulcer disease.22,23 Additionally, diets rich in starch and sugar contribute to the clinical expression of chronic muscle diseases (polysaccharide storage myopathy and recurrent exertional rhabdomyolysis) in genetically susceptible horses24 and likely exacerbate insulin resistance and susceptibility to laminitis in horses and ponies with the metabolic syndrome phenotype.25 Therefore equine veterinarians should have working knowledge of carbohydrate digestion and metabolism and methods for assessment of the carbohydrate fractions in feeds. This information can be used in the formulation of diets and feeding programs that control intake of certain carbohydrates and potentially mitigate risk of these conditions.
Classification and Nomenclature
Plant carbohydrates in equine feeds can be subdivided into the structural carbohydrates (SCs), which largely make up the fibrous portion of the diet and originate from the plant cell wall, and the nonstructural carbohydrates (NSCs), which originate from the cell content. Diets for horses, whether based on pasture, conserved forage, concentrates, or a combination of all three, contain both SCs and NSCs.26
All dietary carbohydrates contain similar amounts of gross energy. However, when utilized by the horse, they provide variable amounts of DE, metabolizable energy, and net energy.27 Carbohydrates digested and absorbed as monosaccharides in the small intestine yield more energy than carbohydrates digested by microbial action (predominantly fermentation), and a glycemic response to the ingestion of such carbohydrates tends to occur.28 The type of linkage between the monosaccharide residues in the carbohydrate also affects the site of digestion of these compounds and thus their nutritional value. Hydrolysis of the α1-6 and the α1-4 linkages of starch and maltose, for example, can occur in the equine small intestine, but horses do not produce the enzymes necessary to digest the β1-4 linkages found in cellulose or the mixed linkages found in hemicellulose.28 Therefore digestion of cellulose and hemicellulose must occur as a result of microbial fermentation, which does not result in a pronounced glycemic response. Stachyose, raffinose, β-glucans, fructooligosaccharides (or fructans), and pectin are also thought to be resistant to enzymatic hydrolysis. Thus an understanding of the various carbohydrates fractions in plants (including means of digestion) is needed to determine the potential for a feed to result in a glycemic-insulinemic response.
SIMPLE SUGARS
This fraction comprises monosaccharides and disaccharides (i.e., glucose, fructose, and sucrose). The simple sugar content of these plants is low; the sugars produced by way of photosynthesis can be used immediately by the plant to supply energy for metabolism, protein synthesis, and growth, or they can be elaborated into more complex oligosaccharides (e.g., raffinose and stachyose) or the structural polysaccharides of the plant cell wall (e.g., cellulose, hemicellulose, and pectin). When sugar production exceeds the immediate requirements for metabolism, the excess sugars are polymerized to form “storage,” or “reserve,” carbohydrates. Storage carbohydrates mostly are in the form of starch or fructan. Starches, fructans, together with the simple sugars and the oligosaccharides, make up the NSC fraction of the diet.26
STRUCTURAL POLYSACCHARIDES
This fraction includes dietary fiber that is composed of cellulose, pectin, and hemicelluloses, along with mannans, galactans, and xyloglucans.26 Total nonstarch polysaccharides (NSPs) are the sum of the water-soluble and water-insoluble NSPs and include cellulosic and noncellulosic polysaccharides. Although some of the NSPs are water soluble, these are not digestible by mammalian enzymes, and digestion therefore can occur only through fermentation, which may occur proximal to the cecum.
STARCH
Starch is the main storage polysaccharide in most higher plants, including the forage legumes (e.g., clover, alfalfa). Starch is stored in both the vegetative tissues (i.e., nonreproductive tissues such as leaves and stems) and the reproductive tissues (i.e., flowers, seeds). The starch content of grass seed ranges from approximately 300 to 400 g starch/kg seed DM, whereas oats, barley, and corn contain approximately 400, 550, and 700 g starch/kg DM, respectively.26 The amount of starch stored in the leaves of legumes rarely exceeds 75 g starch/kg DM.
Starch consists of polymers of glucose, which occur in two forms: amylose and amylopectin. Amylose is a linear α-(1-4) linked molecule, and amylopectin is a larger, highly branched molecule containing both α-(1-4) and α-(1-6) linkages. The ratio of amylose to amylopectin largely depends on the botanical origin of the starch. For example, in wheat flour amylose is around 30% of the total starch, whereas corn can contain up to 70% amylose. The extent to which starch is digested prececally depends on many factors, including the availability of the starch to mammalian enzymes (e.g., the extent to which any outer husk or hull has been broken down), the ratio of amylose to amylopectin within the starch granule, the effect of processing (thermal treatment, for example, improves the digestibility of corn and barley starch), and intestinal passage rate.29 Glucose availability in the small intestine tends to be higher for starches with high amylopectin content. As discussed in more detail later, the ingestion of excessive levels of starch may exceed the relatively limited amylolytic capacity of the equine foregut. Any undigested starch (including resistant starch) that has not been fermented in the stomach and small intestine by resident microbes will pass into the large intestine, where it will be fermented, yielding less net energy than when it is absorbed as glucose.29
FRUCTAN
Fructan is the major storage carbohydrate of the vegetative tissues of temperate grasses. Depending on the number of fructose molecules, fructans can be described as oligosaccharides (<10 monosaccharide units) or polysaccharides (>10 units). High levels of fructan can accumulate in the vegetative tissues of pasture grasses, with implications for the development of pasture-associated laminitis.26 In a 3-year northern European study of the water-soluble carbohydrate (WSC; sugar plus fructan) components in the vegetative structures of temperate grasses, fructan contents of up to 279 g/kg DM were recorded.26 Fructan accumulation (unlike that for starch) can occur below the temperature threshold for plant growth (approximately 6° C).30 Therefore cold, bright days that result in high rates of photosynthesis but minimal plant growth may lead to the production of large quantities of excess sucrose and, in turn, substantial fructan accumulation.
Evaluation of the Carbohydrate Content in Feeds
A number of analytical techniques and terms have been used to describe the carbohydrate fractions in feeds. It is important to understand what the different terms mean—and recognize the variation among laboratories with respect to analytical methods and definitions (see Box 5-1).
NONSTRUCTURAL CARBOHYDRATES
The NSC fraction includes the monosaccharides and disaccharides, oligosaccharides (including fructan), fructan polysaccharides, and starch. Several methods have been used to estimate the NSC content of feeds. The system developed by Van Soest31 estimates NSC by difference, wherein the feed is partitioned into neutral detergent solubles and NDF. The NDF fraction contains cellulose, most of the hemicellulose, and lignin. Until recently, the NSC content of a feed was determined on the basis of feed analysis and the “by-difference method,” according to the following equation:

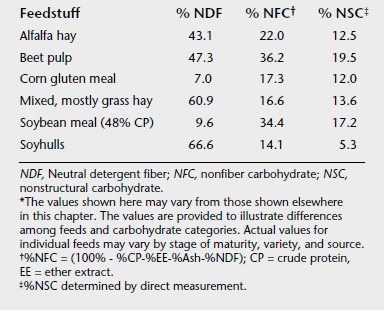
This estimate was taken to represent the combined sugar, starch, and fructan content of the feed. However, it also includes pectins, gums, and mucilages that, unlike starch, sugar, and fructan, are not subject to very rapid fermentation and therefore do not induce the marked changes in lactic acid concentrations and pH within the hindgut that can occur with excess intake of sugars, starch, or fructan. Therefore the NSC by-difference fraction is now referred to as nonfiber carbohydrate, or NFC. The quantitative difference between measured NSC and NFC is small for some feeds (e.g., cereal grains) but can be quite large for other feeds (e.g., feeds with substantial pectin, such as sugar beet pulp) (Table 5-2).
TABLE 5-2 Neutral Detergent Fiber, Nonfiber Carbohydrate, and Nonstructural Carbohydrate Composition of Selected Feedstuffs on a Dry Matter Basis∗
Carbohydrate Nutrition and Colic
Colic is caused by many conditions, each of which may be related to specific risk factors, such as changes in diet, feeding practices, exercise patterns, and housing or inappropriate parasite control programs. An association between feeding practices and disturbances in gastrointestinal function has long been hypothesized,32,33 but the mechanisms linking diet with the development of intestinal dysfunction are poorly understood. Indeed, the exact relationship between diet and colic is difficult to determine because of the variety of feeds and feeding practices used throughout the world as well as differences in study populations. Furthermore, it is often difficult to separate the effects of diet and feeding schedule from other management practices, which often depend on the horse’s breed and use. Nonetheless, the results of recent epidemiologic studies support the proposition that diet composition and recent changes in diet are important risk factors for development of colic.34–39 Tinker et al.37 prospectively examined the risk for colic at 31 horse farms over a 1-year period. Both a change in concentrate feeding (odds ratio [OR] = 3.6 relative to no colic) and the feeding of high levels of concentrate (>2.5 kg/day dry matter, OR = 4.8, >5 kg/day dry matter, OR = 6.3, relative to feeding no concentrate) were identified as risk factors for colic. In addition, colic risk increased when processed feeds such as pellets were fed. Hudson et al.36 reported that a recent (within 2 weeks) change in type of grain or concentrate fed (OR = 2.6), the feeding of more than 2.7 kg of oats per day (OR = 5.9), and a change in the batch of hay fed (OR = 4.9) were significant risk factors for an episode of colic. In another prospective case-control study, neither the amount nor type of concentrate fed was associated with the colic risk, although the researchers did conclude that horses at pasture may have a decreased risk of colic.38 On the other hand, a recent (within 2 weeks) change in diet, in particular the type of hay fed (including hay from a different source or cutting of the same type of hay) was a significant risk factor for colic.38 In this study feeding hay other than coastal/Bermuda or alfalfa significantly increased the colic risk, but this finding may have reflected hay quality and digestibility rather than type of hay per se. Changing to a poorer quality, less digestible hay or feeding wheat straw or cornstalks may predispose horses to large colon impaction.38 In a practitioner-based colic study in the United Kingdom, a recent change in management was associated with at least 43% of the cases of spasmodic or mild undiagnosed colic. The most common management change was turnout onto lush pasture in the spring.39 In reviewing the results of available epidemiologic studies, Cohen estimated that approximately one third of colic cases had a history of a recent change in diet.40 The ingestion of high-concentrate and low-forage diets has also been implicated in the development of gastric ulcers, which in turn may result in signs of colic.23
Carbohydrate Digestion and Hindgut Function
From a digestive viewpoint carbohydrates in horse feedstuffs can be divided into three main fractions: (1) hydrolyzable carbohydrates (CHO-H), which can be digested in the small intestine by mammalian enzymes (or they can be fermented, both in the foregut and hindgut); (2) rapidly fermented carbohydrates (CHO-FR), which cannot be broken down by mammalian digestive enzymes but are readily available for microbial fermentation; and (3) slowly fermentable carbohydrates (CHO-FS). The hydrolyzable fraction includes hexoses, disaccharides, some oligosaccharides, and the nonresistant starches. Although some fermentation of these compounds may occur in the stomach, the primary products of digestion of these compounds are monosaccharides that can be absorbed in the small intestine, with a relatively high energy yield. The rapidly fermentable fraction included pectin, fructan, and some oligosaccharides not digested in the small intestine. Resistant starch and neutral detergent hemicellulose could also be included in the rapidly fermentable fraction. The slowly fermentable carbohydrate fraction includes cellulose, hemicellulose, and ligno-cellulose that result primarily in the production of acetate in the large intestine.
FOREGUT DIGESTION
Carbohydrate digestion begins in the stomach, which in the horse is relatively small and inelastic (capacity 9-15 L for a 500-kg horse). Bacterial fermentation of ingested feed is initiated in the cranial (squamous) portion of the stomach, with conversion of some of the available simple sugars or starches to lactic acid.41 This microbial activity and starch/sugar degradation slows when the gastric contents pass to the fundic gland region and are mixed with gastric secretions containing pepsinogen. Horse saliva contains minimal amylase activity, and little enzymatic carbohydrate digestion occurs in the stomach.
The small and large intestines are the primary sites of carbohydrate digestion. Starch digestion in the small intestine first involves degradation by α-amylase into disaccharide (maltose), trisaccharide (maltotriose), and α-dextrin units. Subsequently, there is hydrolysis of maltose, maltotriose, and α-dextrin units by small intestine brush border glycanases, primarily amyloglucosidase (AMG), to form free glucose.42 The disaccharidases sucrase, lactase, and maltase are expressed along the length of the small intestine.43 d-glucose and d-galactose are transported across the equine intestinal brush border membrane by a Na+/glucose co-transporter type 1 isoform (SGLT1),43 and fructose is absorbed by way of an equine-specific GLUT-5 transporter.15 The activity of both transport proteins is highest in the duodenum and lowest in the ileum.15 Sugars taken up by enterocytes are transported down concentration gradients into the circulation by way of the GLUT-2 transporter. Preliminary studies have demonstrated upregulation of small intestinal SGLT1 expression with an increase in dietary starch content.44
It has been proposed that starch digestion in the small intestine is limited by amylolytic activity (e.g., the availability and activity of α-amylase). The activity of α-amylase in pancreatic tissue of horses is low relative to that of other species,45 although the activities of brush border glycanases appear to be comparable to those observed in humans, pigs, and dogs.46,47 The activity of α-amylase in pancreatic tissue of horses fed either hay or hay and concentrate for at least 8 weeks was unaffected by diet.46 However, in a related study, the amylase activity of jejunal chyme was modestly higher in horses that received a diet with added corn, oats, or barley when compared with only hay.47
The extent of starch digestion in the small intestine is affected by the type and amount of starch digested (see the section on strategies for minimizing gastrointestinal disturbances).48 At low levels of starch intake (<100 g/100 kg body weight from oats, barley, or corn as a single meal), approximately 80% of the starch was digested in the small intestine. When starch feeding was doubled (250 to 270 g/100 kg body weight), prececal starch digestibility decreased to between 50% and 55%.49 Therefore most nutritionists recommend that an individual grain or concentrate meal contain no more than 2 g starch per kg body weight. For example, if a grain concentrate is 50% starch, no more than 4 g/kg bodyweight (Bwt) or approximately 2 kg for a 500-kg horse should be fed. At higher intakes in a single meal, particularly when unprocessed corn or barley is fed, there is the risk of substantial starch overflow into the hindgut, where it will undergo rapid fermentation.
HINDGUT DIGESTION
The equine large intestine (cecum and colon) is an enlarged fermentative chamber that contains an extremely abundant and highly complex community of microorganisms. Although some fermentation of feedstuffs occurs in the stomach and small intestine, most fermentation occurs in the hindgut. The microbial hydrolysis of dietary plant fiber within the large intestine leads to the release of soluble sugars that are subsequently fermented to the VFAs acetate, propionate, and butyrate, which are an important source of energy. In addition, the VFAs (particularly butyrate) regulate the expression of genes controlling proliferation, apoptosis, and differentiation of gut epithelial cells.50
The rate of fermentation and the microbial and biochemical contents of the large intestine are affected by diet composition and feeding pattern (i.e., continuous grazing, or small, frequent meals, versus large meals administered twice daily). A change from forage only to a forage and concentrate diet will result in an increased rate of fermentation and marked changes in the microbial population, luminal pH, and the contents of VFA and lactate.51 The extent of these changes is likely dependent on the nature and abruptness of the dietary change. With a sudden increase in grain (i.e., starch) feeding, a portion of the ingested starch passes into the cecum undigested, where it undergoes rapid fermentation with increased production of lactate and gas and a decrease in cecal-colonic pH. Increasing proportions of grain result in decreased acetate and increased propionate and lactate contents of the cecum and colon.51 Other biochemical changes with the rapid fermentation of starch (or other CHO-FR, such as fructan) in the hindgut may include an increase in the production of vasoactive monoamines (e.g., tyramine, tryptamine), endotoxins, and exotoxins, all of which have been implicated in the pathogenesis of laminitis.52
After an increase in starch feeding, the numbers of lactobacilli and total anaerobic bacteria increase, whereas the numbers of xylanolytic and pectinolytic bacteria decrease.53 Overall, there is an increase in amylolytic, lactic acid–producing bacteria and decreases in the proportions of acid-utilizing (particularly lactate) and cellulolytic (i.e., fiber-degrading) bacteria. Reduced efficiency of fiber utilization and decreased energy yield may result from the decline in cellulolytic bacteria with high grain feeding. In horses fed forage only, pH within the cecum and colon is in the range of 6.7 to 7.0. The feeding of increasing amounts of corn or barley starch is associated with proportionate decreases in cecal pH, with values approaching 6.0 when 3 to 4 g/kg Bwt is fed as a single meal.51,54,55 A similar dose of oat starch was not associated with a significant decrease in pH, consistent with other data demonstrating higher prececal digestibility of oat starch versus barley and corn starch.55 Some nutritionists have suggested that a cecal pH of 6.0 represents subclinical acidosis and that the risk of clinically apparent intestinal dysfunction (e.g., increased permeability) is substantially increased when hindgut pH is less than 6.0.2,55 Similar disruptions to the hindgut environment probably occur with the delivery of other rapidly fermentable substrate, such as fructan, which can compose 5% to 40% of grass DM,26 particularly temperate species such as perennial ryegrass and timothy. In vitro experiments have demonstrated that fructan induces a more rapid decrease in the pH of cecal contents compared with corn starch,56 and one type of fructan (raftilose) has been used to induce carbohydrate overload and laminitis.57
These disturbances to the hindgut environment put the horse at greater risk for digestive disturbances such as colic, osmotic diarrhea, and laminitis.32,33 Scenarios favoring the presentation of large loads of rapidly fermentable substrate to the hindgut include (1) a sudden introduction to grain feeding or an abrupt increase in the amount of grain concentrate; (2) the feeding of large grain meals that, even in horses adapted to such feeds, overwhelm the hydrolytic or absorptive capacity of the small intestine; and (3) the grazing of lush pasture or forage with high contents of rapidly fermentable substrate such as fructan and simple sugars. It is therefore apparent that feeding strategies designed to minimize hindgut disturbances must focus on reducing the flow of rapidly fermented substrate to the cecum and large colon.
Recommendations for Minimizing Digestive Disturbances
ADEQUATE FORAGE AND FIBER
For hard-working horses with high DE requirements, the provision of roughage is often restricted in favor of grain concentrates to ensure adequate DE intake within limits of typical dry matter consumption. However, there is considerable circumstantial evidence associating low-roughage diets with digestive disturbances (e.g., hindgut acidosis, colic, gastric ulcers) and behavioral problems. There also is evidence that the adverse effects of high starch intake on hindgut function are mitigated when the ration is at least 50% NDF.58 Accordingly, there is rationale for feeding programs that promote higher roughage intake. An absolute fiber requirement has not been defined, but a minimum of 1.0 kg long-stem forage per 100 kg Bwt (i.e., 5.0 kg for a 500-kg horse, as fed basis) has been recommended. Some nutritionists have suggested that a rate of 1.5 kg per 100 kg Bwt is preferable. Alternatively, fiber intake can be increased by feeding other sources such as sugar beet pulp or soya hulls, both of which are highly digestible (i.e., the DE yield is higher compared with that of hay) and are now commonly added to energy supplements for horses. This approach also facilitates a decrease in reliance on grain or sweet feed for energy, thereby decreasing the risk of digestive disturbances associated with high starch intake.


