Amino acids (mM)
Obese (n = 74)
Lean (n = 67)
P value
Valine
281.4 (249.2, 332.9)
235.3 (204.1, 257.0)
<0.0001
Leucine/Isoleucine
170.0 (150.2, 200.8)
149.0 (132.5, 176.6)
<0.0001
Glutamate/Glutamine
118.4 (91.4, 143.7)
81.2 (66.7, 95.2)
<0.0001
Glycine
282.6 (245.6, 319.6)
328.4 (265.6, 403.0)
0.0007
Alanine
433.4 (394.5, 492.3)
367.3 (297.1, 420.0)
<0.0001
Phenylalanine
72.6 (66.3, 78.9)
61.6 (55.1, 68.8)
<0.0001
Tyrosine
79.5 (68.5, 90.0)
67.1 (56.7, 73.5)
<0.0001
Aspartate/Asparagine
20.1 (17.3, 23.8)
16.5 (13.5, 19.7)
<0.0001
Arginine
135.2 (116.5, 148.5)
115.3 (101.6, 137.0)
0.0007
Citrulline
32.0 (27.9, 40.3)
36.3 (30.5, 40.7)
0.04
Histidine
81.6 (73.5,88.9)
81.9 (71.9, 91.6)
0.57
Methionine
27.5 (25.1, 30.7)
27.6 (24.2, 30.9)
0.68
Omithine
69.6 (55.3, 80.8)
64.8 (53.3, 71.8)
0.18
Proline
176.4 (155.4, 231.5)
158.1 (138.4, 201.7)
0.02
Serine
115.6 (100.7, 131.9)
116.7 (102.2, 138.6)
0.69
Tryptophan and phenylalanine may help in the fight against obesity by burning fat more efficiently and suppressing appetite. Many researchers suggest that certain supplements, amino acids in particular, may be effective in weight loss programs. Tryptophan supplements tend to diminish the desire for carbohydrates. And since most overweight people seem to favor sweet, processed carbohydrate foods, it may be helpful in weight loss. Phenylalanine suppresses the appetite by increasing the production of the neurotransmitter norepinephrine.
In another hand, the prevalence of pre-pregnancy obesity has increased and is estimated to be almost 30 % among reproductive aged women (Artal et al. 2010; Kim et al. 2007a, b, c; Ogden et al. 2006).
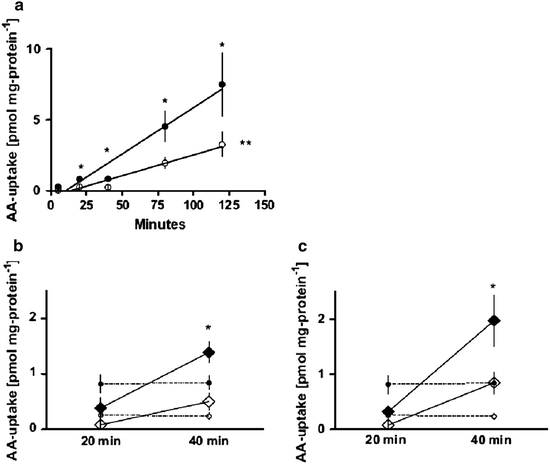
Maternal obesity is associated with increased placental amino acid transport and hyperleptinemia. The study of placental amino acid transport and the effect of leptin on placental amino acid transport in vitro in the setting of maternal obesity was conducted. The obese group had decreased placental sodium-dependent neutral amino acid transporter (SNAT) activity (Fig. 14.1), maternal hyperleptinemia, and decreased syncytiotrophoblast expression of leptin receptor and SNAT-4. Placental amino acid uptake was significantly stimulated by leptin in the lean group as compared to the obese group. Maternal weight gain and offspring birth weights were not different between groups. Maternal obesity was accompanied by decreased placental SNAT activity associated with maternal hyperleptinemia and placental leptin resistance in spite of appropriate maternal weight gain and normally grown neonates (Farley et al. 2010). These findings suggest altered placental function that may have clinical implications in obese pregnant women.


Fig. 14.1
(a) Placental SNAT activity (pmol mg/protein/min), term placental villous fragments. Lean (c, n = 1,017), obese (b, n = 7). *P < 0.05 (20, 40, 80, 120 min time points e lean vs. obese), **P < 0.005 (SNAT activity lean vs. obese), amino acid (AA). (b, c) Effect of leptin stimulation on placental SNAT activity (pmol mg/protein/min), at concentrations of 100 ng/mL (b, lean vs. obese P < 0.07), 500 ng/mL (c, lean vs. obese P < 0.10) in term placental villous fragments (Farley et al. 2010)
14.3 Amino Acids and Diabetes
Diabetes is a typical metabolic disease, with a variety of complications, an important factor in the quality of life of patients, early diabetes. Thus ultra-early detection and prevention are particularly important.
Amino acids are the building blocks of proteins and are also used in the synthesis of DNA, glucose, and ATP. Amino acids as important metabolic network metabolites are associated with diabetes mellitus (Chen et al. 2011; Newsholme et al. 2011). Amino acids may play a direct or indirect (via generation of putative messengers of mitochondrial origin) role in insulin secretion (Newsholme et al. 2007). Amino acids have antidiabetic effects (Sulochana et al. 1998). Specific amino acids are known to acutely and chronically regulate insulin secretion from pancreatic cells in vivo and in vitro (Smith et al. 1997). Mitochondrial metabolism is crucial for the coupling of amino acid and glucose recognition to exocytosis of insulin granules. Mitochondria generate ATP, which is the main coupling messenger in insulin secretion, and other coupling factors, which serve as sensors for the control of the exocytotic process.
Numerous studies have sought to identify the factors that mediate the key amplifying pathway over the Ca2+ signal in nutrient-stimulated insulin secretion. Predominantly, these factors are nucleotides (ATP, GTP, cAMP, and NADPH), although metabolites have also been proposed, such as long-chain acyl-CoA derivatives and glutamate (Newsholme et al. 2005). This scenario further highlights the importance of the key enzymes or transporters, e.g., glutamate dehydrogenase, the aspartate and alanine aminotransferases, and the malate–aspartate shuttle in the control of insulin secretion. In addition, after chronic exposure, amino acids may influence gene expression in the pancreatic beta cells, which subsequently alters levels of insulin secretion. Only a relatively small number of amino acids promote or synergistically enhance insulin release from pancreatic beta cells (Fajans et al. 1967). Four amino acids were found to be particularly important for stimulating beta cell electrical activity, essential for insulin secretion (leucine, isoleucine, alanine, and arginine) (Bolea et al. 1997).
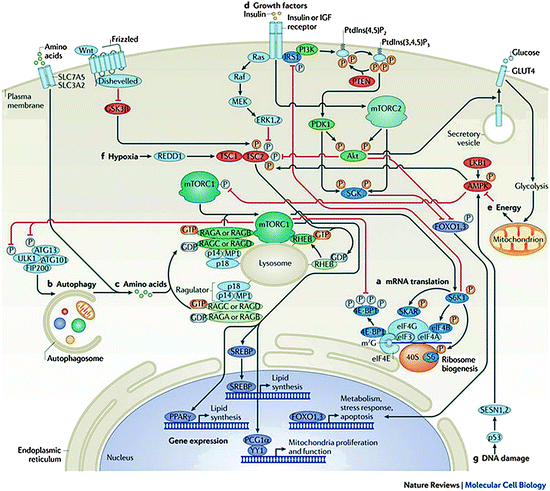
The mechanisms by which amino acids enhance insulin secretion are varied. The cationically charged amino acid, l-arginine, does so by accumulating in beta cells provoking direct depolarization of the plasma membrane at neutral pH but only in the presence of glucose (Blachier et al. 1989), whereas other amino acids, which are co-transported with Na+, can also depolarize the cell membrane as a consequence of Na+ transport and thus induce insulin secretion by activating voltage-dependent calcium channels. Metabolism, resulting in partial oxidation, e.g., l-alanine (Brennan et al. 2002), may initially increase the cellular content of ATP, leading to closure of the ATP-sensitive K+ (KATP) channel, depolarization of the plasma membrane, activation of the voltage-activated Ca2+ channel, Ca2+ influx, and insulin exocytosis. Additional mitochondrial signals may be generated that affect insulin secretion (Maechler 2002). A summary of potential regulatory mechanisms with respect to amino acid-stimulated insulin secretion is illustrated in Fig. 14.2.


Fig. 14.2


ThemTORsignalling pathway. Mammalian target of rapamycin complex 1 (mTORC1) promotes mRNA translation (a) and inhibits autophagy (b) by integrating nutrient signals that are generated by amino acids (c), growth factors such as insulin and insulin-like growth factors (IGFs) (d), energy signals that act through AMP-activated kinase (AMPK) (e), and various stressors including hypoxia (f) and DNA damage (g). Signal integration occurs at the level of the tuberous sclerosis 1 (TSC1; also known as hamartin)-TSC2 (also known as tuberin) complex. Akt and extracellular regulated kinase 1 (ERK1) and ERK2 phosphorylate TSC2, thus inhibiting the GTPase activating protein (GAP) activity of TSC1–TSC2 towards Ras homologue enriched in brain (RHEB). By contrast, phosphorylation of TSC2 by AMPK and glycogen synthase kinase 3β (GSK3β) results in the activation of TSC1–TSC2. The hypoxic factor protein regulated in development and DNA damage response 1 (REDD1; also known as DDIT4) promotes the assembly and activation of TSC1–TSC2. A second level of integration occurs at the lysosome: the Rag GTPases (which are held in place by the Ragulator, which consists of p18, p14, and MAPK scaffold protein 1 (MP1)) recruit mTORC1 to the lysosomal surface in response to amino acids (c); in turn, lysosomal recruitment enables mTORC1 to interact with GTP-bound RHEB, the end point of growth factor (d), energy (e), and stress (f, g) inputs. Growth factor receptors activate mTORC2 near the plasma membrane (d), where mTORC2 may be recruited through binding of mammalian stress-activated map kinase-interacting protein 1 (mSIN1; also known as MAPKAP1) to phospholipids. Because of its role in phosphorylating and activating Akt, mTORC2 forms a core component of the phosphoinositide 3-kinase (PI3K) pathway. Activating and inhibitory phosphates are orange and gray, respectively. 4E-BP1 eIF4E-binding protein 1, ATG autophagy-related, CBP80 80 kDa nuclear cap-binding protein, eEF2K eukaryotic elongation factor 2 kinase, eIF eukaryotic translation initiation factor, FIP200 200 kDa FAK family kinase-interacting protein, FOXO forkhead box protein O, IRS1, insulin receptor substrate 1, MEK MAPK/ERK kinase, PDK1 3-phosphoinositide-dependent protein kinase 1, PGC1α PPARγcoactivator 1α, PKC protein kinase C, PPARγ peroxisome proliferator-activated receptor-γ, PTEN phosphatase and tensin homologue, S6K1 S6 kinase 1, SESN sestrin, SGK serum- and glucocorticoid-regulated kinase, SREBP sterol regulatory element-binding protein, SKAR S6K1 Aly/REF-like target (also known as POLDIP3)
Stay updated, free articles. Join our Telegram channel

Full access? Get Clinical Tree


