Antibody
Type
Company (catalog number)
Dilution
Mouse Anti-Neuronal Nuclei (NeuN)
Monoclonal Antibody
Mouse monoclonal
Chemicon, Millipore
(MAB377)
1:50
Neurofilament H Non-Phosphorylated (SMI 32) Monoclonal Antibody
Mouse monoclonal
Covance (SMI-32R)
1:200
Monoclonal Anti-Glial Fibrillary Acidic Protein (GFAP)
Mouse monoclonal
Sigma (G3893)
1:100
Polyclonal Rabbit
Anti-S100
Rabbit polyclonal
Dako (Z0311)
1:100
Monoclonal
Anti-Oligodendrocyte Marker O4 Antibody
Mouse monoclonal
R&D Systems (MAB1326)
1:200
Rabbit Anti-NG2 Chondroitin Sulfate Proteoglycan
Polyclonal Antibody
Rabbit polyclonal
Chemicon, Milipore (AB5320)
1:100
Rabbit Anti Iba1 (Ionized calcium binding adaptor molecule 1) antibody
Rabbit polyclonal
Wako (019-19741)
1:500
Mouse Anti-Oligodendrocytes
Monoclonal Antibody RIP
Mouse monoclonal
Chemicon, Milipore (MAB1580)
1:1,000
Cleaved Caspase-3 (Asp175) Antibody
Rabbit monoclonal
Cell Signaling Technology (9661)
1:50
Poly(ADP-ribose), mAb (10 H) (PAR)
Mouse monoclonal
Alexis, Enzo Life Sciences (ALX-804-220)
1:50
Alexa Fluor 488 or 594
Secondary Antibodies
Goat anti-mouse or goat anti-rabbit
Invitrogen (A-10680, A-11008, A-11005, A1012)
1:500
Paraformaldehyde (PFA), bovine serum albumin (BSA), Triton X-100, xylene, 4′,6-diamidino-2-phenylindole dihydrochloride (DAPI), and toluidine blue are purchased from Sigma-Aldrich. Normal goat serum (NGS) is obtained from Chemicon, while Vectashield Mounting Media for fluorescence are from Vector Laboratories.
To analyze and count the cells in spinal cord sections after immunofluorescence staining, we use the following softwares: MetaVue from Molecular Devices (Sunnyvale, CA, USA) and CellCounter software from GlanceVision Technologies (Trieste, Italy).
3 Methods
3.1 Spinal Cord Preparation
Experiments are performed on thoracolumbar spinal cord preparations isolated from neonatal Wistar rats (0–2 days old) under urethane anesthesia (0.2 ml i.p. of a 10% w/v solution). After decapitation and evisceration, the vertebral column with surrounding tissue is pinned to the Sylgard-coated bottom of a Petri dish at room temperature and the spinal cord is carefully dissected out under microscopic control. During this phase, the tissue is superfused with Krebs solution of the following composition (in mM): NaCl, 113; KCl, 4.5; MgCl27H2O, 1; CaCl2, 2; NaH2PO4, 1; NaHCO3, 25; glucose, 11; gassed with 95% O2 5% CO2; pH 7.4 at room temperature. Extra care is applied to the isolation of pairs of roots (usually between T10 and S1 segments) that will be used for recording and electrical stimulation. The preparation (with roots attached) is transferred to a recording chamber continuously superfused (7.5 ml/min) with the same Krebs solution. Miniature suction electrodes are used to record from four ventral roots (VRs) and to stimulate dorsal roots (DRs). Figure 1 shows a photograph of the spinal cord setup for recording and stimulating with multiple electrodes, where  and
and  indicate recording and stimulating, respectively.
and indicate recording and stimulating, respectively.Fig. 1.
Electrophysiological setup for studying locomotor network activity. (a) Photograph of rat isolated spinal cord preparation pinned to the bottom of a Sylgard-coated Petri dish. An array of miniature suction electrodes is used to stimulate DRs and to record electrophysiological responses from VRs. Recording electrodes are indicated by  while stimulating electrodes are indicated by
  . (b) Example of chemically evoked fictive locomotion characterized by alternating cyclic oscillations present on four lumbar roots following bath application of NMDA and 5HT. (c) Example of a bout of fictive locomotion induced by a train (30 pulses at 10 Hz) applied to one DR and observed as cyclic oscillations on all four VRs. (d) Example of spontaneous disinhibited bursting recorded from one VR following application of strychnine (1 μM) and bicuculline (20 μM) (unpublished data by G.T.)
while stimulating electrodes are indicated by . (b) Example of chemically evoked fictive locomotion characterized by alternating cyclic oscillations present on four lumbar roots following bath application of NMDA and 5HT. (c) Example of a bout of fictive locomotion induced by a train (30 pulses at 10 Hz) applied to one DR and observed as cyclic oscillations on all four VRs. (d) Example of spontaneous disinhibited bursting recorded from one VR following application of strychnine (1 μM) and bicuculline (20 μM) (unpublished data by G.T.)3.2 Electro-physiological Recording
To record fictive locomotor rhythms for a long time, the majority of experiments are based on DC-coupled recordings from four lumbar VRs (26) as exemplified in Fig. 1b. Fictive locomotion is typically evoked by continuous bath application of NMDA (5 μM) and 5HT (10 μM). In particular, lumbar (L) 2 (denoting the spinal segment) VRs express mainly flexor motor commands to the hindlimb skeletal muscles, while L5 VRs convey mainly extensor motor signals to the same limbs. When these discharges occur at 2–4/s periodicity and alternate between flexor and extensor motor pools and between left (l) and right (r) sides, the pattern has all the properties typical of fictive locomotion (13, 27) as demonstrated in Fig. 1b. Intracellular recordings from lumbar motoneurons are obtained using sharp electrodes filled with 3 M KCl (30–60 MΩ resistance) or 2 M Kacetate (60–100 MΩ; ref. (26)) connected to an AxoClamp amplifier (0.1 preamplifier gain; Molecular Devices, Sunnyvale, CA, USA) in a current-clamp mode. The motoneuron field is approached by tracking down with the sharp electrode to meet a large negative-going field potential. When the field is inverted because of the very close proximity to a single motoneuron, a brief oscillation of the negative capacitance control or of the electrode clearance switch is adequate to impale a motoneuron. Motoneurons are identified by their all-or-none antidromic action potential induced by weak stimulation of the corresponding VR (usually 0.05 ms pulse width; 1 V intensity at 0.5 Hz). Typical electrophysiological parameters are membrane potential, action potential, and synaptic potential induced by stimulation of the corresponding DR. The input resistance of motoneurons is measured by delivering hyperpolarizing current steps (0.1–0.9 nA, 30–50 ms) through the intracellular electrode: current/voltage curves are constructed within the linear range (from −70 to −60 mV). All data are acquired and analyzed off-line with pCLAMP software (Molecular Devices, Sunnyvale, CA, USA).
DR electrical stimuli are employed to elicit responses recorded from either a motoneuron or the ipsilateral VR or cumulative depolarization (1–30 V stimulus applied to one DR; 0.1 ms duration; 30 pulse trains at 1–2 Hz). Stimuli are regarded as low T when they do not exceed 2× stimulus strength to evoke a detectable synaptic response from the recorded motoneuron or VR. High T stimuli are larger than 2× T (28). To minimize variability, DR stimulation-induced responses are averages of at least five events, of which the amplitude and area are calculated.
3.3 Induction of Fictive Locomotion
This pattern is normally elicited with two protocols: (1) Trains of DR stimuli (see Sect. 3.2) that evoke cumulative depolarization upon which a bout of alternating oscillations emerges normally for a few tens of seconds (Fig. 1c). (2) Continuous bath application of N-methyl-d-aspartate (NMDA; 4 or 5 μM) plus serotonin (5-hydrohytryptamine; 5-HT; 10 μM) (29, 30) as shown in Fig. 1b. This rhythm can be maintained for a long time (tens of min) without fading.
All rhythmic discharges are analyzed for their period defined as the time between the onset of two cycles of oscillatory activity. The regularity of the rhythm is calculated in terms of coefficient of variation (CV; given by standard deviation (SD) mean−1) of the period. Signal correlation between pairs of VRs is expressed with the cross-correlation function (CCF) using pCLAMP software. While CCF > +0.5 indicates synchronicity between two VRs, CCF < −0.5 shows full alternation.
Disinhibited bursting (17, 18, 31) is a highly regular pattern of all-or-none discharges arising from synchronous activation of motor pools in distinct spinal segments. It is characterized by very large depolarization of motoneurons or VRs (lasting 7–10 s) at a low periodicity (1 every 20–30 s). Disinhibited bursting is produced by continuously bath-applied strychnine (1 μM) and bicuculline (10 μM) that unmask the latent excitability of spinal networks in the absence of synaptic inhibition (Fig. 1d). Disinhibited bursting can also be electrically driven by DR stimulation. Burst duration is calculated between the event onset and the start of the rapid decay, while the period is the time interval between the onset of a burst and the next one.
3.4 Experimental Lesion Protocol for the Isolated Spinal Cord
Several clinical studies show that, under the most favorable conditions, the average admission time to hospital emergency care for acute SCI is approximately 3 h (32–34). Nonetheless, stabilization of metabolic conditions is expected to begin earlier at the lesion site (35). Thus, the protocol for in vitro SCI attempts to mimic the early pathophysiological events of SCI. To obtain consistency and to allow cross-sectional study comparison, toxic agents are applied to produce spinal cord damage for 1 h to the whole spinal cord preparation. This approach is in close agreement with the observed excitotoxicity evoked by 1 h microdialysis of glutamate applied to the in vivo rat spinal cord (36). Control preparations are kept for the same time in vitro without any drug or toxic agent administration (sham preparations). The various protocols are schematically summarized in Fig. 2a. Prior to any toxic challenge, a series of electrophysiological tests (fictive locomotion, DR stimulation, or induction of disinhibited bursting with strychnine and bicuculline) is performed to establish the baseline conditions of network activity. In all protocols, the toxic medium is applied for 1 h only followed by extensive washout with oxygenated standard Krebs solution for 24 h when the outcome of the lesion in terms of morphological and functional features is systematically investigated. Repeated electrophysiological tests are run during and after the toxic solution washout to monitor any on-going change in network activity before the study end point at 24 h.
Fig. 2.
Scheme of protocols used for SCI experiments. (a) The isolated spinal cord is first tested for electrophysiological responses that include DR stimulation, fictive locomotion, or disinhibited bursting (STR + BIC). If using sham conditions, after overnight rest, the preparation is retested 24 h later and then processed for histology (top row ). Middle row shows the protocol for fictive locomotion followed by the application of the toxic solution for 1 h, its washout and retesting of the electrophysiological responses 24 h later. Bottom row shows a similar approach in which, instead of fictive locomotion, disinhibited bursting is tested followed by the toxic solution, washout, and retest the day after. (b) Recipe for the composition of pathological medium (PM) that mimics the severe metabolic perturbation is thought to be generated in the spinal cord after acute injury. This solution can be applied for 1 h as per protocol in A.
It is noteworthy that, on the same preparation, we normally test either fictive locomotion or disinhibited bursting in order to avoid potential interference by the neurochemicals used to elicit such rhythms with the pathological processes. This is particularly important for the application of strychnine and bicuculline, whose effects are very slowly reversible on washout. Sham preparations (24 h in vitro) reproduce standard fictive locomotion or disinhibited bursting indicating no deleterious action of the in vitro maintenance (11).
The present protocol for excitotoxicity relies on the application of kainate, a metabolically stable potent analogue of glutamate. Kainate is not a substrate for the glutamate uptake carriers and has been extensively used to produce excitotoxicity (37–39). In vivo injection of kainate into the rat spinal cord is known to produce extensive damage with motor paralysis (40–42). Thus, to induce excitotoxic damage to spinal networks, kainate is applied for 1 h at 1 mM concentration and then washed out, while its effects are monitored for up to 24 h (Fig. 2a). This concentration of kainate is adequate for rapid and irreversible loss of fictive locomotion. Our studies have also indicated that lower concentrations of kainate (50–500 μM) produce comparable functional damage and cell loss at 24 h, although the rate of damage development is significantly slower (8). Figure 3a shows an example of the relatively rapid onset depolarization of motor pools recorded from four VRs (see Fig. 1a for electrophysiological arrangement) by applying kainate (1 mM). Noisy traces indicate repetitive discharges elicited during the strong depolarization that reaches a plateau usually sustained throughout the kainate application. The functional consequences (24 h later) of 1 h application of this neurotoxic drug on fictive locomotion evoked by NMDA and 5-HT are exemplified in Fig. 3b, in which full suppression of this rhythm is observed. Figure 3e shows that disinhibited bursting persists 24 h later although the burst amplitude is strongly impaired.
Fig. 3.
Effects of kainate on the rat spinal cord in vitro. (a) Example of electrophysiological recording from four lumbar VRs. Application of kainate (arrow ) elicits depolarization with superimposed irregular discharges to reach a steady-state plateau. The kainate application lasts for 1 h and is followed by 24 h wash. (b) Chemically evoked fictive locomotion is observed in control condition (sham; left ) but it is absent 24 h after kainate application (right ). (c ) Histological examination of sham spinal tissue in the ventral area shows good cell preservation observed with DAPI (top) or toluidine blue (bottom) staining. (d) 24 h after kainate administration, extensive pyknosis (recognizable by small, round shape of cell nucleus and intense staining) is detected with either dye. (e, f ) Example of disinhibited bursting (sham preparation) with strong regular bursts detected from one VR, a phenomenon greatly attenuated in amplitude after kainate, although burst frequency and regularity are preserved. Unpublished data by M.M. and G.T.
A more complex toxic solution (Fig. 2b) is used to mimic the chemical environment thought to be induced at the site of neuronal injury and to contribute to secondary spinal damage. This involves changes due to lack of oxygenation that leads to ionic alterations, pH acidification, edema (with reduced osmolarity), and production of endogenous toxic metabolites. In practice, to achieve this condition, the experimental solution is not gassed with a mixture of O2/CO2 because simple arrest of oxygen delivery to a spinal preparation in vitro produces severe hypoxia (43). We have actually measured (with a miniature O2 electrode) the pO2 values in the experimental bath and found that they usually fall to 196 ± 2 mm Hg (i.e., 46 ± 0.5% with respect to normal oxygenated Krebs solution). With this solution, Mg2+, glucose, and NaHCO3 are also omitted, while Hepes is added to reach pH 6.75–6.80 (with 0.1 N NaOH). Osmolarity is 230–240 mOsm, thus recreating the hypoosmotic milieu surrounding an acute lesion (44, 45). H2O2 and sodium peroxynitrite (SNP; a NO donor) are also added to produce toxic free radicals. This solution is termed pathological medium (PM; Fig. 2b). Figure 4 exemplifies the effect of PM on the spinal cord in vitro. PM depolarizes motor pools (Fig. 4a) and triggers rapid oscillations recorded from two VRs. After 1 h application, the consequences (24 h later) are less severe on locomotor functions since low amplitude, less regular cycles of fictive locomotion can be observed (Fig. 4b), while disinhibited bursting is very similar to control (Fig. 4c).
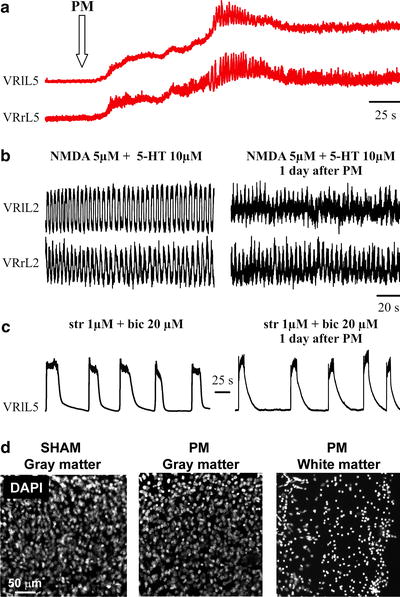
Fig. 4.
Effects of pathological medium (PM) on rat spinal cord in vitro. (a) Electrophysiological effects of PM applied at the time indicated by the arrow. A slowly developing depolarization with superimposed irregular discharges is observed. This phenomenon is quantitatively less intense than the one detected following application of kainate. (b) Chemically evoked fictive locomotion of a sham preparation (left ) is detectable also 24 h after PM application and washout (right ). Note, however, that oscillatory cycles are of smaller amplitude and are less regular. (c) Example of disinhibited bursting of a sham preparation (left ) compared with the similar pattern observed 24 h after PM (right ). Note substantial preservation of this phenomenon. (d) Examples of rat neonatal spinal cord sections (30 μm) cut out from sham preparation (dorsal region, left ) or from preparation formerly exposed to PM (dorsal, middle). Note limited number of DAPI-stained pyknotic nuclei. Conversely, the ventrolateral white matter (right ) shows massive pyknosis of the PM-treated spinal cord preparation. Panels (a–c) are modified from ref. (11), while histological pictures are unpublished work by M.M.
An additional protocol includes the combined administration of kainate with the PM to explore the consequences of metabolic disruption plus a primary excitotoxic agent. In this case, the resulting effects are a very severe destruction to the spinal tissue (11).
3.5 Focal Damage to the In Vitro Spinal Cord
The methods described in Sect. 3.4 are helpful to investigate the early evolution of SCI and to provide a substantial amount of tissue suitable for morphological and molecular biology experiments. Nevertheless, as SCI is often patchy and incomplete, it seems important to study whether and when a focal lesion can extend to spared tissue. To achieve this aim, it is very advantageous to partition the rat spinal cord preparation into subcompartments that allow the administration of different solutions to distinct segments of the spinal cord. This approach can be successfully obtained by the use of plastic barriers which do not damage the spinal tissue, yet they restrict the application of substances to preselected areas only.
The use of barriers to investigate the site of action of drugs and the distribution of locomotor networks has been reported before (46–49). Figure 5a shows how this method is applied in our laboratory. It is of paramount importance to establish that barriers themselves do not create tissue mechanical damage with dysfunction of synaptic transmission and impulse conduction. Indeed, at the start of each experiment, it is important to check that the basic electrophysiological properties of in vitro spinal cord are not impaired. Hence, we routinely stimulate DRs above and below the barriers to elicit robust responses from VRs below and above, respectively, as a way to confirm full tissue viability. As a norm, we place barriers at the level of the lower thoracic spinal cord to enclose three or four segments down to L1–L2. Figure 5a shows an example of placing such barriers to create an isolated compartment (filled with phenol red solution to check it remains leak proof). One recording electrode is connected to a VR within the central compartment, while other recording or stimulating electrodes are used for VRs and DRs above and below the central compartment. Such responses are present even the day after, with unchanged peak amplitude, even though the late polysynaptic component can be attenuated (12).The schemes in Fig. 5b and c indicate how this arrangement is obtained and the fact that below the segments within the central compartment there is a grove to allow access to the bathing solution. The reason for this device is to avoid applying any toxic substance to just one side of the spinal cord and to restrict the damage to the exposed region only.
Fig. 5.
Transverse barrier arrangement for isolated spinal cord. (a) Photograph of rat isolated spinal cord preparation pinned to the bottom of a Sylgard-coated Petri dish and partitioned by two barriers to create a central compartment separately superfused from the top and bottom ones. The central compartment is filled with a phenol red solution to test its leak-proof condition. Note array of miniature suction electrodes to stimulate DRs and to record electrophysiological responses from VRs. Abbreviations are as in Fig. 1a legend. (b, c) Schematic representation of the transverse barrier arrangement to indicate that the central compartment is fully superfused to avoid a dishomogeneous distribution of the toxic solution.
Figure 6a shows how, for 1 h of continuous recording, spinal segments above (T6) and below (L5) the central compartment (T13) respond to application of kainate plus PM. T13 produces a large and relatively persistent depolarization (middle trace in Fig. 6a), while the responses of T6 (top trace) is brief and small, and the one from L5 (bottom trace), albeit larger, fades away.


Fig. 6.
Remote effects of toxic solution on distant segments of the rat spinal cord with barrier partitions. (a) Simultaneous recording from three VRs from the start of PM plus kainate application (left arrow ) is maintained for 1 h when washout is effected (right arrow ). The top and bottom traces are from VRs outside the central compartment to which the toxic solution (PM plus kainate) is applied. Note depolarization recorded from all VRs, although only the middle one is maintained up to the washout time point. (b) Top, fast-time base records of the same responses shown in (a) to indicate the irregular discharges present on four VRs outside the central compartment containing the toxic solution. Bottom, on a faster timescale, after a few cyclic oscillations, very asynchronous activity is observed on all VRs. (c) Left, disinhibited bursting is observed on three VRs prior to the toxic solution administration to the central compartment (middle trace). At the end of toxic solution application (PM plus kainate), bursting is slowed down on the top VR, almost blocked on the middle VR (inside the central compartment), and fully present on the bottom VRs. (d) Records from four VRs outside the central compartment that was superfused with PM plus kainate. Fictive locomotion evoked by NMDA and 5-HT is lost on all VRs during the washout phase after PM plus kainate. Nonetheless, the rhythm returns 24 h later indicating the transient nature of locomotor network block outside the region immediately treated with the toxic solution. (e) Examples of sagittal spinal cord sections (30 μm) cut out from a preparation are locally exposed to the PM plus kainate. The upper panels show the spinal cord tissue from lumbar (L3) segment outside the barriers and, thus, not exposed to the toxic medium, while lower panels show the lumbar segment (L1) within the two barriers and are exposed to the toxic solution. The sections are stained with toluidine blue (left panels) and by immuno-fluorescence with antibodies specifically recognizing different cell types, namely NeuN for neurons, RIP for myelin sheath of oligodendrocytes, and GFAP for astrocytes. Note extensive tissue and cell destruction in the region directly exposed to the toxic medium. a is modified from ref. (12), b, c, d are unpublished data by G.T. and e are unpublished data by M.M.
< div class='tao-gold-member'>
Only gold members can continue reading. Log In or Register to continue
Stay updated, free articles. Join our Telegram channel
Full access? Get Clinical Tree
