Fig. 1.
(a) Ruptured intracerebral aneurysm results in rapid hemorrhage into the subarachnoid spaces. Increased intracranial pressure, reduced cerebral blood flow, and perfusion pressure lead to cellular injury. Auto-oxidation of oxyhemoglobin (OxyHb) in the CSF thought to produce superoxide anion and hydroxyl radical. These strong oxidizing agents result in significant lipid, protein and DNA damage. Breakdown products may also contribute to delayed cerebral vasospasm. (b) Computed tomography with angiography demonstrating ruptured anterior communicating artery aneurysm. Three-dimensional reconstruction of ruptured 1.1 cm3 saccular ACA aneurysm. Head CT without contrast reveals hemorrhage within the central interhemispheric fissure and frontal lobe parenchyma, resulting in surrounding vasogenic edema formation 48 h following subarachnoid hemorrhage.
Mechanisms underlying immediate morphologic changes within brain parenchyma following SAH are poorly understood. Acute phase injury is caused by rapid distribution of blood into the subarachnoid space, elevation of intracranial pressure (ICP) (3), reduced cerebral perfusion pressure (CPP), and cerebral blood flow (CBF) (4–6). These insults have been shown to cause direct microvascular injury, plugging of vessels and release of vasoactive substances by platelet aggregates (7–9), alterations in the nitric oxide (NO)/nitric oxide synthase (NOS) pathways and lipid peroxidation (10) (Fig. 2). Investigators have utilized various methods to assess the cellular and molecular cascades following the hemorrhagic event. Signaling pathways, which ultimately determine degree and distribution parenchymal injury, are activated within seconds of aneurysm rupture (11).
Fig. 2.
Cascade of injury following subarachnoid hemorrhage. Early brain injury results from immediate physiologic disruption and mechanical damage to surrounding parenchyma. Ultimate neuronal loss is consequence of multifactorial cascade leading to ischemia and breakdown of cellular metabolism.
2 Methods
2.1 Animal Preparation for Neuropathology
Rodents are anesthetized with pentobarbital sodium (65 mg/kg, i.p.) and perfused transcardially with 100 ml wash solution (0.8% NaCl, 0.4% dextrose, 0.8% sucrose, 0.023% CaCl2, 0.025% sodium cacodylate ) followed by 150 ml perfusion solution (4.0% sucrose, 4.0% paraformaldehyde, 1.072% sodium cacodylate). Brains are removed from skull, stored in fixative overnight, and incubated serially in 10, 20, and 30% sucrose in Dulbecco’s modified phosphate buffered saline (DPBS) for 24 h. Brains can then be cryosectioned (25 μm) on the axial plane and stored in DPBS with 0.1% sodium azide until used.
2.2 Immuno-histochemistry
To visualize immunoreactivity, free floating brain sections are stained using a modified ABC procedure (Vector Laboratories; Burlingame, CA). Sections are treated with 10% hydrogen peroxide in DPBS for 15 min to quench endogenous peroxidases. Following 3× rinses in DPBS for 5 min, sections are incubated in a permeabilizing solution (1.8% l-lysine, 4% normal horse serum, 0.2% Triton X-100) for 30 min at room temperature. Sections are transferred directly to primary antibody solution with 4% horse serum (rabbit anti-protein of interest; 1:400; Abcam; Cambridge, MA) and incubated overnight at room temperature. The following day, sections are rinsed 3× in DPBS for 5 min and transferred to the secondary antibody for 2 h (anti-rabbit IgG; 1:1,000; Invitrogen). Following 3× rinses in DPBS for 5 min, sections are incubated in Avidin d-HRP (1:1,000; Vector Laboratories) for 1 h at room temperature; rinsed 3× in DPBS, and incubated with Nova Red (Vector Laboratories) for 5 min. Following a 5 min rinse in distilled water, sections can be mounted onto microscope slides, air-dried overnight, dehydrated through a standard ethanol series, and coverslipped. Demonstrated in Fig. 3.
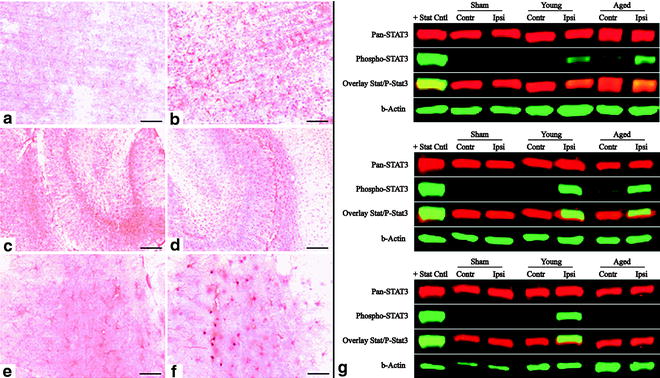
Fig. 3.
MCAO induces reactive gliosis and nuclear translocation of STAT3 in astrocytes. At 24 h following MCAO in young rats, enhanced immunostaining of GFAP-positive cells (astrocytes) was observed in ipsilateral cortex (b) compared to the GFAP immunostaining observed in contralateral cortex (a). Basal GFAP immunostaining was observed in contralateral hippocampus (c) that was enhanced in ipsilateral hippocampus (d). MCAO also resulted in the appearance of STAT3 immunoreactivity in astrocytic nuclei (b, d, f). (b) Western blot analysis of STAT3 activation following MCAO in rodents. At 6, 24, and 72 h following MCAO, STAT3, and pSTAT3 expression were evaluated quantitatively by immunoblot analysis. (DiNapoli et al. 2010).
2.3 Confocal Microscopy for Blood–Brain Barrier Assessment
Confocal assessment of blood brain permeability can be achieved utilizing lysine fixable dextran (70,000 Da; AlexaFlour 488) and fibrinogen (300,000 Da; AlexaFlour 568). A milligram of marker can be dissolved in 0.5 ml of 0.9% saline and injected into the femoral vein during or preceding the injury model. Rats are anesthetized and transcardially perfused with 0.9% saline for 5 min then 4% paraformaldehyde/0.1 M sodium cacodylate buffer (pH 7.2). Brains are removed and postfixed in 4% paraformaldehyde overnight. Areas of interest are cut into 4 mm blocks, sliced into 60 μm sections, and assessed for fluorescent reactivity using a confocal microscope and analyzed. This technique is demonstrated in Fig. 4.
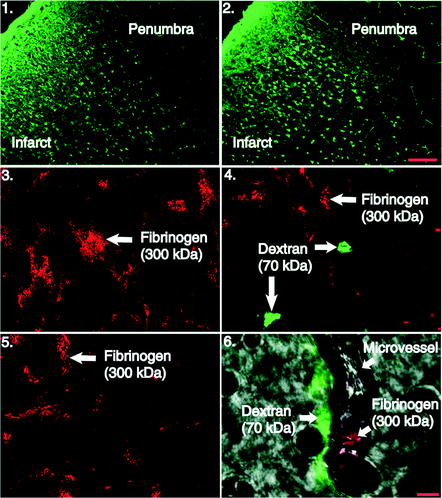
Fig. 4.
Photomicrographs of Fluoro-Jade B stained sections and confocal microscopy following MCAO. Damaged neurons within the infracted region are fluorescently stained (green) while surviving neurons within the pneumbra are left unstained (scalebar = 100 m). Frames 3–6, confocal microscopy of vascular permeability markers dextran (70 kDa) and fibrinogen (300 kDa) 24 h post-MCAO and rt-PA reperfusion, taken in the penumbral region of the infarct. Frames 3 and 4, confocal images of fibrinogen (red) and dextran (green) reactivity in the ipsilateral cortex. No dextran extravasation is observed in frame 3 and is similar to images from contralateral hemisphere in frame 5. Dextran is present in the extracellular space frame 4 animals at the same time point. Frame 6, image in bright field that depicts lumen of cerebral microvessel. Fibrinogen can be seen remaining within the lumen of the vessel while dextran reactivity is present along the outer surface in animal that underwent MCAO and rt-PA reperfusion (scale bar = 5 μm). (DiNapoli et al. 2008).
2.4 Evans Blue Albumin Extravasation
Albumin extravasation can be accessed by infusion with 2% Evans blue (4 ml/kg) via the femoral artery. The Evan’s blue is allowed to circulate for 1 h and the rats perfused with cold PBS (pH 7.4) for 15 min via the left ventricle. The brains are excised; meninges and ependymal organs removed, hemispheres excised, separated, weighed, and homogenized in 500 μl of 50% trichloroacetic acid. The tissue is incubated for 24 h at 37°C, and then centrifuged at 13,000 × g for 10 min. The supernatants are diluted fourfold with absolute ethanol; fluorescence intensity is measured using a fluorometer at 620 nm excitation, 680 nm emission (Beckman DU 640). Calculations are based on external standard readings and extravasated dye expressed as ng EB/mg brain tissue.
2.5 RNA Isolation, cDNA Synthesis, and Real-Time PCR Amplification
Total RNA is isolated using Trizol® reagent (Invitrogen; Carlsbad, CA). Concentration and purity of RNA was determined using a biophotometer and considered for use only if A260/A280 was between 1.8 and 2.1. Total RNA (1 μg) is reverse-transcribed to cDNA using SuperScriptä III RNase H- and oligo (dT) 12–18 primers (Invitrogen) in a 40 μl reaction. Real-time PCR analyses are performed using a PCR system (Applied Biosystems; Foster City, CA) in combination with TaqMan® chemistry. Glyceraldehyde-3-phosphate dehydrogenase (GAPDH) can be used as an endogenous control to normalize for differences in the amount of cDNA added to reactions. Specific primers and dual-labeled internal fluorogenic (FAM/TAMRA) probe sets (TaqMan® Gene Expression Assays) for genes of interest are used according to the manufacturer’s recommendation (Applied Biosystems). All PCR amplifications (40 cycles) are performed in a total volume of 50 μl, containing 1 μl cDNA, 2.5 μl of the specific assay on Demand® primer/probe mix, and 25 μl of TaqMan® Universal master mix (Applied Biosystems). Relative quantification of gene expression is performed using the comparative threshold (CT) method as described by manufacturer (User Bulletin 2; Applied Biosystems). Changes in mRNA expression level were calculated following normalization to GAPDH and expressed as fold change over corresponding controls.
3 Early Changes
Aneurysmal rupture confers immediate effects on the surrounding tissue; recent theories have begun to describe these acute events as early brain injury (EBI). EBI results from decreased CBF and perfusion pressure mediated by increased ICP and acute vasoconstriction (5). Destruction of the microvascular architecture augments global ischemia and initiates a cascade of cellular injury.
3.1 Cerebrovascular Physiology
The vascular events following SAH have been the focus of clinical and scientific investigation. The acute changes in vascular physiology and morphology immediately following SAH are poorly understood, and likely contribute to early fatality. Reduction in CPP and CBF related to acute increases in ICP is theorized to be the primary cause of acute brain injury following SAH (12). A rapid peak in ICP occurs within 60 s of vessel rupture, and returns quickly to a value at or near baseline, followed by a later more sustained rise (4). It has been demonstrated, in animal models, that a decrease in CBF to less than 40% of baseline at 60 min posthemorrhage is associated with 100% mortality, while animals with CBF greater than 40% of baseline at 60 min had a survival rate of 81% (5). Contrary evidence has suggested the magnitude of CPP reduction after SAH to be insufficient to result in cerebral perfusion arrest. Additionally, increased ICP or decreased CPP are not always associated with poor neurologic outcomes following SAH (13), and therefore cannot entirely account for acute ischemic damage.
3.2 Changes in Vascular Morphology
Disruption of the microcirculation, at the capillary level, is the result of increased blood viscosity (14), formation of microthrombi (15), adherence of platelet aggregates (11), and vessel wall injury. Destruction of basal lamina components within cerebral microvessels, by collagenases and matrix metalloproteinases (MMPs), has been demonstrated within 3 h (16). Friedrich et al. have recently described endothelial damage and leakage of platelets into the brain parenchyma as early as 10 min following SAH. They demonstrate platelet aggregation and extravasation, at sites devoid of endothelium and collagen IV, thought to be mediated by collagenases released by activated platelets (17). Inflammatory mediators, such as intercellular adhesion molecules-1 (ICAM-1), vascular adhesion molecule-1 (VCAM-1), and E-selectin contribute to accumulation of neutrophils, monocytes, and lymphocytes at the endothelial membrane within 24 h (18). These factors coalesce to result in the loss of structural integrity, which can affect vascular tone, increase intravascular pressure and permeability, leading to edema and extravasation of erythrocytes (11, 19)
3.3 Edema Formation
Global parenchymal edema demonstrated by computed tomography has been documented early in patients admitted with SAH (20). Sudden rise in ICP and the presence of SAH have been shown to cause endothelial dysfunction and disrupt interendothelial junctions of the blood–arterial wall barrier. This disturbance in permeability of major cerebral arteries (21) leads to vasogenic and, secondarily, cytotoxic edema. Decreased tissue oxygenation leads to increased blood–brain barrier (BBB) permeability by a progressive loss of component antigens from the basal lamina and extracellular matrix, as well as alterations in endothelial cell–cell and cell–matrix interactions within the first few hours of ischemia (22, 23). Extravasation of large proteins (300 kDa) across the BBB has been observed as early as 20 min following ischemic onset in rodents (24) (Fig. 4). Upregulation of aquaporin protein channels 1 and 4 following SAH is thought to be involved in edema formation and elimination, recent evidence shows increased brain edema in AQP-4 null mice at 6 h post-SAH (25). Maintenance of the osmotic homeostasis between the intra- and extracellular compartments is disrupted, causing a cytotoxic environment.
4 Metabolic Failure and Cell Death
The absence of oxygen causes transition from aerobic mitochondrial respiration and ATP production to anaerobic glycolysis. This produces progressive acidosis due to the formation of lactic acid and an increase in free radical production, while increased glutamate and anoxic depolarization cause excitotoxicity. These cascades result in proteolysis, lipolysis, DNA damage, and ultimately neuronal loss (11). Necrosis develops in areas of critical ischemia while the neighboring penumbral region is affected by free radical production, toxic metabolites, and spreading depolarizations (26) (Fig. 5), leading to a spectrum of apoptosis to necrosis dependent upon degree of ischemic insult. The vasculature and circumventricular regions are particularly susceptible to necrosis following SAH (27, 28). The focus of scientific and clinical investigation has been on discovery of novel therapies to promote survival of the penumbral tissue by targeting cell survival pathways.
Fig. 5.
Cortical Spreading Depolarizations and Ischemia in SAH patient. This figure shows a temporal cluster of four depolarizations spontaneously recurring within a 3 hr period. Each depolarization, measured as a 10-20 mV negative shift in direct current electrocorticography (DCECoG; Hartings et al., 2009), is significantly prolonged, evidencing limited energy supply for tissue repolarization and a developing ischemic lesion. Cerebral blood flow measured by laser doppler flowmetry (LD-CBF) adjacent to the ECoG electrode shows pathologic ‘inverse’ neurovascular coupling, i.e. transient hypoperfusions in place of the hyperemic response observed in normal cortex. Methods are described in Dreier et al., 2009. Figure courtesy of JP Dreier (Berlin, Germany), JA Hartings (Cincinnati, OH), and T Watanabe (Silver Spring, MD).
4.1 Oxidative Stress
The homeostasis of reactive oxygen species (ROS) production and their neutralization by intrinsic antioxidant systems is upset following SAH in both humans and animal studies (29, 30). Mitochondrial production of superoxide is a consequence of electron transfer chain disruption by excessive calcium concentrations causing free electrons to react with oxygen, overwhelming the superoxide dismutase system under ischemic conditions. Auto-oxidation of oxyhemoglobin (OxyHb) in the CSF releases superoxide anion and hydrogen peroxide, which is then catalyzed by iron released from OxyHb to form hydroxyl radical. These strong oxidizing agents result in significant lipid, protein and DNA damage (31), leading to cellular apoptosis, endothelial injury, and BBB permeability (32, 33). OyxHb has also been shown to induce the expression of R-type voltage-dependent calcium channels in cerebral arteries (34), which contributes to increased vessel constriction following SAH (35).
Accumulation of intracellular calcium activates several enzymes leading to additional free radical production; these include NOS, xanthine oxidase (XO), and phospholipases. The neuronal and inducible isoforms of NOS are upregulated in SAH, and the overall effect of these enzymes is debated. It is hypothesized that nitrogen oxide (NO) radical may play different temporal roles as ischemia develops and matures. NO augments CBF via vasodilation in the acute phase of injury, while 6 h post-SAH this effect is lessened and NO becomes a contributor to cellular damage by creating additional oxidation (11).
4.2 Signaling Pathways Involved in Early Brain Injury
Apoptosis has been observed in the hippocampus, BBB and vasculature (27, 28), after aneurysm rupture. Several apoptotic pathways are implicated in SAH: the death receptor pathway, caspase-dependent and independent pathways, as well as the mitochondrial pathway (36). SAH is thought to activate the death receptor pathway primarily via the tumor necrosis factor receptors (TNFR). Tumor necrosis factor alpha (TNF-α) is upregulated following SAH and thought to activate internal apoptotic cascades via p53 and Fas ligand (37). Recent evidence also suggests a role for p53 in a caspase-independent pathway, acting through the mitochondrial protein apoptosis-inducing factor. The caspase independent and dependent pathways are both mediated via the pro-death Bcl-2 family of proteins.
< div class='tao-gold-member'>
Only gold members can continue reading. Log In or Register to continue
Stay updated, free articles. Join our Telegram channel

Full access? Get Clinical Tree


