Chapter 29 Hemodialysis and Extracorporeal Blood Purification
Intermittent hemodialysis is an extracorporeal renal replacement therapy (RRT) used primarily to manage the biochemical and fluid disorders of uremia. Hemodialysis was performed first in experimental dogs in 19131,57 and now is established as the foundation for the management of end-stage kidney disease in human patients.78 Hemodialysis has been described in dogs for nearly this same period, but only recently has it transitioned from clinical obscurity to the advanced standard for the management of acute renal failure in dogs and cats.34,38,59,96 The demand for hemodialysis in veterinary therapeutics has expanded rapidly in the past 10 years, and today hemodialysis facilities have been established throughout the United States as well as in Brazil, India, Israel, Italy, Switzerland, Thailand, Portugal, and Japan for applications in companion animals. The dog and cat equally share the demand and use of therapeutic hemodialysis, and extracorporeal techniques and equipment for the delivery of hemodialysis are safe and effective for animals as small as 1.5 kg and or as large as 600 kg. Diverse creatures from tortoises and rabbits to sheep and horses have been managed with creative modifications of the procedures and equipment devised for human application.37
The primary therapeutic application for extracorporeal therapies in animals is for the supportive management of uremia as a renal replacement therapy (Box 29-1). No conventional medical therapies can reproduce the efficacy of extracorporeal procedures for correction of the cumulative biochemical, acid-base, endocrine, and fluid disorders associated with kidney failure. Acute kidney injury is the most common indication for intermittent hemodialysis in dogs and cats. Delay in instituting dialysis leads to greater uremic symptomatology, morbidity, and recruitment of additional organ dysfunction.34,37,59 Indefinite use of intermittent hemodialysis in animals with chronic kidney disease is equally indicated, but cost and logistic realities have limited its routine use for this indication in animals in contrast to human therapeutics. Finite periods of hemodialysis may be prescribed as part of the perioperative management of animals undergoing renal transplantation. Preoperative dialysis facilitates the surgical candidacy and surgical stability of the patient. Postoperatively, hemodialysis is used in the management of delayed graft function, acute rejection, surgical complications, or pyelonephritis to support the animal until the episode has resolved. Extracorporeal therapies, including hemodialysis or hemoperfusion, alone or in combination can be used to clear toxins and toxic metabolites from animals after accidental poisoning or drug overdose.34,148,161,185 The use of extracorporeal therapies for toxin removal is gaining greater recognition as an important extension of extracorporeal techniques in veterinary therapeutics.
Box 29-1 Indications for Dialytic and Extracorporeal Therapies in Animals
Acute Kidney Injury
2. Failure of fluid administration or diuretic therapy to initiate an adequate diuresis
3. Failure of conventional therapy to control the azotemia, biochemical, or clinical manifestations of acute uremia
4. Life-threatening fluid overload
5. Life-threatening electrolyte (hyperkalemia, hypernatremia, hyponatremia) or acid-base disturbances
6. Severe azotemia—BUN >100 mg/dL; serum creatinine >10 mg/dL
7. Clinical course refractory to conservative therapy for 12 to 24 hours
Physical principles of hemodialysis
The diffusive potential for every solute varies under differing physiologic condition. Molecular weight is the main determinant of kinetic motion and contributes inversely to the rate of diffusion for individual solutes. Small solutes such as urea (60 Da) diffuse faster than larger solutes such as creatinine (113 Da), and generally the plasma concentration of small solutes decrease faster than those of larger solutes during the course of dialysis.47,142 The intrinsic permeability of a membrane for each solute also influences directly its diffusive potential. Membrane permeability is determined by its thickness, its effective surface area, and the number, size, and shape of its pores or diffusion channels.142 In addition to intrinsic solute and membrane characteristics, molecular charge, protein binding, volume of distribution, and cellular seclusion influence the bulk transfer of uremia toxins and solutes from the body independently from their predicted diffusion.
Convective transport of solutes across dialysis membranes is associated with the process of ultrafiltration, in which water is driven through the membrane by hydrostatic pressure gradients. Diffusible solutes dissolved in the water are swept through the membrane by solvent drag.142 Unlike diffusive transport, convective transport does not require a concentration gradient across the membrane and does not alter diffusive gradients or serum concentrations. The transmembrane hydrostatic pressure gradient between the blood and dialysate compartments, the hydraulic permeability, and the surface area of the membrane determine the rate of ultrafiltration and solute transfer. During hemodialysis, a dialysate-directed transmembrane pressure gradient (dialysate pressure < blood-side pressure) is generated to initiate and control the rate of ultrafiltration. Independent changes in the dialysate- and blood-side pressures can influence the rate of ultrafiltration by attendant changes to the transmembrane pressure. The hydraulic permeability of a dialyzer is determined by physical features of the membrane (e.g., composition, thickness, pore size) and is rated by its ultrafiltration coefficient, Kuf, defined as milliliters of fluid transferred per hour per milliliters of mercury of transmembrane pressure. Hemodialyzers are qualified as low flux or high flux according to their Kuf. A minimal transmembrane pressure of 25 mm Hg is required for ultrafiltration to offset the oncotic pressure of plasma proteins, which favors fluid reabsorption and opposes ultrafiltration. Convective transport can contribute to total solute removal, especially for large solutes with limited diffusibility. However, for standard hemodialysis, ultrafiltration primarily is targeted at fluid removal, and convective clearance contributes less than 5% to total solute removal. Convective clearance techniques are exploited further in the process of hemofiltration where solute removal occurs entirely by ultrafiltration with replacement of desired solutes and fluid with a prefilter or postfilter reinfusion solution. Hemodiafiltration and continuous renal replacement therapy (CRRT) represent hybrid treatment modalities combining both diffusive dialysis and large volume ultrafiltration to achieve solute and fluid removal.15,81
Uremia Toxins, The Role of Urea, and adequacy of hemodialysis
Uremia retention solutes (uremia toxins) are broadly classified based on their physicochemical properties as small (water-soluble) solutes (MW, <500 Da), middle molecules (>500 Da), and protein-bound solutes (>15,000 Da).178,179,180,182 The foundations for this arbitrary classification have been based primarily on their characteristics for dialytic removal.182 The volume of distribution of each of these substances further determines its compartmentalization and accessibility for dialytic removal.23,97,178,182 Hundreds of solutes have demonstrated intrinsic toxicity that mimics or reproduce particular aspects of the uremic syndrome, and thousands of retained solutes have now been demonstrated by mass spectroscopy in uremic subjects.133,177,182 Some retained solutes, such as urea, have minimal inherent toxicity but serve as markers for retention of similar but unidentified solutes with greater clinical significance.49,180
Small water-soluble solutes have demonstrated significance in the expression of uremia because both the morbidity and mortality of uremia can be corrected by their removal with conventional dialysis.179,182 Extensive prospective studies in human patients with kidney failure confirm significant outcome benefits associated with the extent of small-molecular-weight solute removal (i.e., dialysis dose).71,73,106,120,124 However, uremic toxicity is more complex than can be explained by retention of small-molecular-weight solutes and attention has refocused on retention of middle molecules and protein-bound solutes that are poorly removed by dialysis.74,77,133,177,182
There is an empirical link between the appearance of uremic signs and the accumulation of nitrogenous end-products of protein (amino acid) oxidation. Urea is a small-molecular-weight (60 Da) nitrogenous metabolite whose plasma concentration exceeds that of all other uremic solutes. It contributes minimally to the clinical manifestations of uremia86 but has remained fundamentally associated with the morbidity and outcome of uremic syndrome because of its abundance and its link to the metabolism of dietary and endogenous nitrogen.49,64 No single retention solute (including urea) has been shown to explain the major consequences of the uremic syndrome. Azotemia must be viewed as a marker for the collective appearance of numerous small water soluble compounds, protein carbamylation, redirected metabolic pathways, or other small-molecular-weight solutes coupled to nitrogen metabolism and/or bound to body proteins.
The proven correlation of urea removal by hemodialysis with outcome in renal failure has prompted the designation of urea as a surrogate index for all putative small-molecular-weight retention solutes that remain unidentified or unmeasured.49,82,120 Reduction of urea appearance and the extrarenal removal of urea are used to prescribe the therapy for uremia and to monitor the efficiency and adequacy of these therapies. 50,76,172 This designation is both rational and problematic. Urea is uncharged, present at high concentration, readily detected, and readily diffused across all body fluid compartments and the dialysis membrane. As such, it serves as an excellent solute to document dialyzer performance and whole body clearance of low-molecular-weight solutes. However, these unique features and its minimal uremic toxicity question whether it appropriately or accurately reflects the dialytic behavior of other solutes with more profound uremic toxicity and thus may overrepresent removal of these solutes.68,180,181
Dietary protein intake directly influences the generation rate (appearance) of urea, and dialytic clearance and residual renal function influence its removal from the body. Thus serum urea concentration is poised to reflect renal function and dialytic and nutritional adequacy. The individual contributions of urea generation, its removal, and its distribution volume to steady-state serum urea concentration cannot be differentiated by routine urea measurement; however, perturbations of the steady-state induced by dialysis allow kinetic dissection of these independent parameters by formal urea kinetic analysis in patients undergoing hemodialysis (Figure 29-1).48,64,141 The kinetics of urea generation and removal have become the bellwether of the adequacy assessment of dialysis delivery and nutritional status in uremic subjects. 76 The role of urea to function as a global surrogate for uremic toxicity remains controversial in light of the broader recognition and assessment of middle molecules and protein-bound solutes as retained uremia solutes. Similarly, urea assessment provides an incomplete appraisal of dialysis delivery despite its documented utility and evidence as a predictor of dialysis adequacy. Nevertheless, the clinical assessment of urea and urea kinetic modeling remain the recommended and established indices for determining adequacy and delivery of therapeutic hemodialysis.73,76,82,106,120
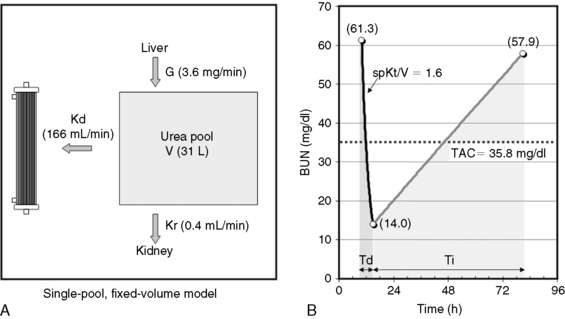
Fig. 29-1 A, Single-pool, fixed-volume kinetic model of the urea metabolism and representative modeled kinetic parameters determined in a 33-kg dog on intermittent maintenance hemodialysis consuming approximately 56 g of dietary protein. Urea is generated in the liver as the major end product of protein metabolism. The urea generation rate, G (mg of urea/min), determines the accumulation of urea in the urea pool with a volume, V (L). Its removal from the urea pool is determined by the continuous residual renal clearance, Kr (mL/min), and intermittently by hemodialysis via the urea clearance of the dialyzer, Kd (mL/min). B, Graphic illustration of a three-point BUN profile (before and after hemodialysis values in parentheses) that can be fitted to the single-pool model in the right panel. With direct measurement of renal and dialyzer urea clearances (Kr, Appendix, Equation 6 and Kd, Appendix, Equation 5, respectively), kinetic modeling allows computation of the urea generation rate (G, Appendix, Equation 9), the urea distribution volume (V, Appendix, Equation 10), and the time-average concentration of BUN (TAC, Appendix, Equation 1). The dose of dialysis expressed as the fractional clearance of the urea distribution volume using single-pool kinetics (spKt/V, Appendix, Equation 11) also can be calculated. Td is the duration of dialysis, and Ti is the duration of the interdialytic interval. AUC is the area under the BUN versus the time curve and can be estimated using a trapezoidal method or ideally calculated by fitting the changes in BUN to the kinetic model.
A variety of manipulation and mathematical models have been developed to characterize the kinetics of urea during dialysis and its relationship to adequacy.* Of these, the fractional clearance of the urea distribution volume (Kt/V) has become the standard measure for the dose of dialysis delivered during a dialysis session.76 From the same analysis, the generation rate of urea (G) can be derived to estimate the protein catabolic rate (PCR) of the patient as a measure of the adequacy of dietary protein intake, and the volume of distribution of urea (V) can be computed to better define hydration and adjustment to the dose (Figure 29-1).
Dialysis adequacy
The optimal outcome for animals with acute renal failure is survival until renal function has recovered, but secondary goals may vary qualitatively depending on the nature of the underlying disease. An optimal outcome additionally should promote physiologic and metabolic stability to facilitate recovery and promote an acceptable quality of life while minimizing secondary injury to the recovering kidneys or other organs (heart, lungs, gut, brain). As an outcome, survival is multifactorial and predicated on the diversity of the underlying cause and comorbidities, in addition to the delivered therapy. As such, outcome assessment by survival alone may be disassociated from recovery of renal function or adequate delivery of dialysis.34,149 Consequently, more sensitive and predictive outcome measures should be considered for assessment of dialysis adequacy, including recovery of renal function, improvement of the systemic manifestations of uremia, and reduction of complications attending uremia or its therapy.19
For both acute and chronic dialysis, survival is a difficult outcome parameter to correlate specifically to dialytic interventions. Yet, despite these constraints, the kinetically modeled dose of dialysis (Kt/V) has been shown to correlate independently with survival as an outcome in humans undergoing maintenance hemodialysis,73,106,120,124 and it is likely to be linked similarly to the success of dialysis in animals. The empirical use of proven standards of dialysis adequacy and clinical experience in human patients are useful first approximations for appropriate veterinary standards of dialysis adequacy until evidence-based standards are determined in animals.34,59
Quantification of hemodialysis delivery and urea kinetic modeling
The delivery (dose) and efficacy of hemodialysis can be expressed in a variety of ways with differing degrees of complexity and utility. Predialysis and immediate postdialysis concentrations of routine serum chemistries (e.g., urea nitrogen, creatinine, phosphorus, bicarbonate, electrolytes) are the simplest expression of efficacy and can be applied similarly to their use in conventional therapy (Figures 29-1 and 29-2).48,105,120,172,183 Although useful to document the instantaneous outcome of the treatment, these assessments do not facilitate the uniform prescription of dialysis to animals of differing size or metabolic status. Nor do they help to clarify the excretory impact of the therapy beyond the intradialytic interval. The predialysis and postdialysis concentrations of plasma urea and creatinine can be expressed further as reduction ratios (URR and CrRR, respectively), which are used routinely to evaluate the intensity of therapy (Appendix, Equations 2 and 3).* Urea reduction ratio (URR) can be expressed either as the fractional or percent in change in urea during the treatment and is the most universally used predictor of adequacy for dialysis sessions in animals (Figures 29-3 and 29-4; Table 29-2). The average dialysis treatment in cats and most dogs will achieve a URR approaching 95%. This high level of treatment intensity is due to a combination of relative long treatment time and relatively smaller patient size (5 to 40 kg) compared with humans in which a URR target is 60% to 65%. In very large animals (50 to 70 kg), this degree of treatment intensity is often difficult to obtain, and a URR of 80% to 85% is typical.
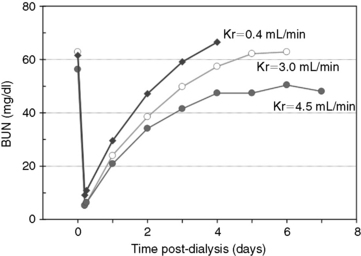
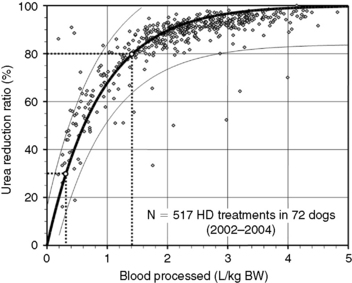
Figure 29-3 Prediction of dialysis treatment intensity (urea reduction ratio [URR]) as a function of the volume of blood processed in 72 dogs undergoing hemodialysis. URR was computed from predialysis and postdialysis BUN concentration (Appendix, Equation 2). The volume of blood processed (Qb × Td) was indexed to body weight to compare dogs of different sizes. The relation (modeled as URR = 1−e−a(Qb × Td/BW), r2 = 0.69) is displayed as a thick solid line with its 95% confidence interval (CI; thin lines). To achieve a low-efficiency treatment with URR equal to 30%, a volume of 0.3 L of blood/kg of body weight must be processed during the treatment (e.g., 6 L in a 20-kg dog). The variation in resulting URR (95% CI, 15% to 45%) underscores the necessity for close monitoring of the delivered (and not prescribed) dose of dialysis for each treatment. Similarly, a URR of 80% is obtained with 1.4 L (95% CI, 0.9 to 2.9) of blood processed per kilogram of body weight (e.g., 28 L in a 20-kg dog).
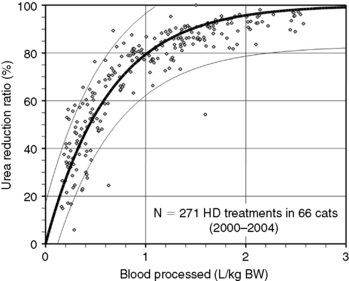
Figure 29-4 Prediction of dialysis treatment intensity (urea reduction ratio [URR]) as a function of the volume of blood processed in 66 cats undergoing hemodialysis. Other conventions are as described for Figure 29-4. The closer correlation (r2 = 0.85) between volume of blood processed and URR in cats compared with dogs is probably because of the more uniform body shape and sizes in this species.
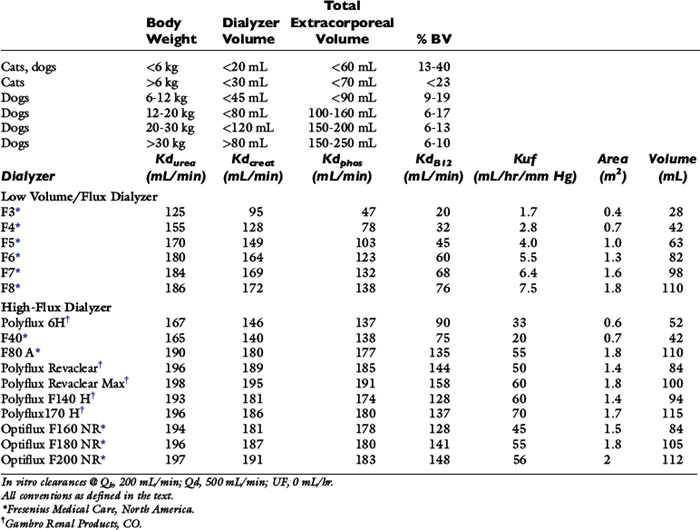
Table 29-1 Recommended Extracorporeal Volumes and Characteristics of Hemodialyzers Used for Hemodialysis in Dogs and Cats
Reduction ratios are convenient for clinical assessment but do not account for all aspects of solute transfer. Uremic toxicity and patient well-being are not predicted necessarily by the highest or lowest concentration or the intermittent change of specific retained uremia solutes.65 The integrated exposure to uremia toxins over time is considered by some a more realistic determinant of well-being and therapeutic adequacy.63,104,106,115,143 For urea, this is expressed as the time-averaged concentration (TACurea), which is calculated as the area under the BUN profile (curve) divided by the duration of the dialysis cycle (Figure 29-1; Appendix, Equation 1). TACurea has been shown to predict morbidity and outcome in human patients undergoing hemodialysis and provides an integrated overview of urea dynamics (and presumably uremia toxicity) during a single or over multiple dialysis cycles. It has been highly predictive of dialysis adequacy and outcome for survival but remains nonspecific and fails to distinguish the multifactorial contributions to urea metabolism during the dialysis cycle, including dialysis dose, urea generation, nutritional adequacy, residual clearance, and distribution volume.48,98,104,107,120
The dose of dialysis delivered to the patient can be defined alternatively by the amount of clearance provided by the hemodialyzer during the dialysis session. Using the measured (instantaneous) clearance of the dialyzer for urea (Kd, mL/min) and the dialysis session length (Td, minutes), the dose of dialysis can be defined as Kd × Td or the volume of the patient cleared of urea (depurated volume) during the treatment (mL). This value can be indexed further to the total reservoir or distribution volume of urea in the patient (V, mL) to compare treatment efficacy among patients of different body sizes as V is equal to the patient’s total body water. This expression is analogous to conventional dosing of drugs as milligrams per kilogram of body weight. The value obtained with this kinetic expression, Kt/V, (Appendix, Equation 11) is unitless and represents the fractional clearance of the urea distribution volume.48,50,64,157,172 Kt/V has become the international reference for dialysis dosing and delivery.76
This assessment of dialysis dose and intensity advances our understanding of the delivery of dialysis during individual treatments but requires the additional measurement of Kd (Appendix, Equation 5) and the imprecise estimation of V from the patients weight and hydration status. These predictions of dialysis dose are limited by simplifying assumptions regarding urea generation, fluid removal, and solute transference during the session, which require more extensive evaluation. A more fundamental understanding and precise description of solute dynamics during dialysis can be derived from kinetic modeling of the intradialytic and interdialytic changes in BUN similar to pharmacokinetic profiles used to describe drug metabolism.48,64,141 Urea kinetic modeling (UKM) is fundamental to understanding the prescription, monitoring, and quality assurance of hemodialysis procedures and must be familiar to all practitioners of this therapeutic modality. It dissects the mutually independent influences of dialysis, residual renal function, nutrition, catabolism, and distribution volume on the intermittent perturbations in urea concentration during and between the dialysis sessions. This kinetic approach to urea metabolism also yields the fractional clearance of urea (Kt/V) as a measure of dose in addition to urea generation rate (G), protein catabolic rate (PCR), and the distribution volume of urea (V) that are ionic dialysance otherwise beyond clinical assessment.
The simplest kinetic assessment of urea during intermittent hemodialysis is represented by a single-pool, fixed-volume model, in which the entire volume of distribution of urea (i.e., total body water) is presumed to behave as a single pool with no change in volume or urea input during the treatments (see Figure 29-1). 47,48,141–143 In this simplified model, the only kinetic variable is total urea clearance (K), which represents the sum of residual renal clearance (Kr) and the clearance of the dialyzer (Kd) (see Figure 29-1; Appendix, Equations 5 and 6).186 The absolute removal of urea in this system will be reflected by the change in urea concentration at any time during dialysis such that:
where Ct is the urea concentration at time = t; C0 is the predialysis urea concentration at t = 0; K is the total urea clearance; and V is the volume of urea distribution. Rearrangement of Equation 1 provides Equation 2 for single-pool (sp) conditions,
Equation 2 is the fundamental kinetic expression for the fractional clearance of urea (dialysis dose) during a single dialysis session. In the simplified single-pool model, the kinetic prediction of dialysis dose can be derived very simply from the measured predialysis and postdialysis BUN concentrations. It must be emphasized, that this expression represents a gross oversimplification of the events and kinetic variables during therapeutic hemodialysis and should be used only to provide a rough estimate of the dialysis dose.
During a therapeutic dialysis session, the relationships between G, V, and K (illustrated in Figure 29-1) are more complex, highly interdependent, and cannot be described mathematically by a single simple relationship. Mathematical description of each variable, however, can be defined in terms of the other two with formal urea kinetic modeling (Appendix, Equations 8 through 10). When one of the variables (G, V, or K) is known, the others can be resolved by simultaneous iterative solution of the equations to yield a unique solution for the unknowns when residual renal clearance (Kr), instantaneous dialyzer clearance (Kd), ultrafiltration volume, and the measured changes in BUN during and after the treatment are known.47,48,141–143 These computations are performed easily with commercially available software or can be programmed into routine spreadsheet applications.
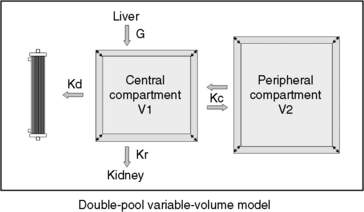
The simplified single-pool, fixed-volume model presumes conditions not generally valid in therapeutic dialysis sessions and loses accuracy if total body water (TBW) changes during or between treatments. The model also loses accuracy during high-efficiency treatments of short duration, when the urea distribution does not behave as a single homogenous compartment. Delayed diffusion from the intracellular compartment or variations in diffusion among discrete fluid compartments (e.g., skin, muscle, gut) with different perfusion and transference characteristics creates a solute disequilibrium between compartments that promotes a postdialysis rebound of urea that is not predicted by immediate postdialysis blood sampling.47,55,126,144 Deviations in the assumptions for single-pool, fixed-volume kinetics can be minimized by measurement of the postdialysis urea at 45 to 60 minutes after the end of the dialysis treatment rather than immediately postdialysis. By this time, intercompartmental shifts (or rebound) have reestablished solute equilibrium, and the plasma concentration reflects the equilibrated concentration of urea across all body compartments.47,151,163As stated previously, therapeutic hemodialysis deviates considerably from the single-compartment model illustrated in Figure 29-1. Retained solutes, including urea, can be distributed in multiple compartments, which are partially secluded from the dialyzer by delayed transfer or differences in regional perfusion. Most dialysis treatments also require ultrafiltration, and urea generation proceeds throughout the session which further deviate the serum urea concentration from single-pool predictions. These deviations from single-pool, fixed volume assumptions can be improved to provide greater accuracy to urea kinetic analysis by using more mathematically complex double-pool142 or noncompartmental kinetic modeling methods (Figure 29-5). The double-pool variable volume kinetic model accounts for intercompartmental solute diffusion during and after completion of hemodialysis, and dpKt/V is regarded as the standard for dialysis dose. Optionally, correction algorithms that account for these compartmental deviations have been applied to single-pool assessments using additional blood sampling and appropriate software in human patients.41,48,69 These correction formulas minimize many of the limitations of single-pool estimates but have not been validated in animals. More accurate predictions of dialysis dose also can be obtained using single-pool kinetic calculations by incorporating an equilibrated BUN obtained 45 to 60 minutes after cessation of the treatment as the end-dialysis value. Use of the equilibrated BUN in the single-pool calculations yields eKt/V as a measured dialysis dose that closely approximates the dpKt/V and better reflects whole patient clearance. Both the eKt/V and the dpKt/V assessments of dialysis dose will be lower than dose predicted as the spKt/V.
Online measurement of these kinetic determinants of dialyzer performance and dialysis dose can be computed in real-time with ionic dialysance techniques that advance the monitoring of individual dialysis sessions and ensure adequate dialysis delivery (Figure 29-6). Automated, bloodless kinetic modeling systems using ionic clearance are available on many modern delivery systems and provide kinetic assessments for each dialysis treatment as an alternative to blood-based modeling techniques.24,67,108,114,118 Dialysance of a dialyzer is a measure of solute mass transfer across the dialysis membrane when the solute is present in both the blood and dialysate. Ionic dialysance is a kinetic assessment of the transfer characteristics of the ionic solutes in the blood and dialysate. The collective concentration ionic solutes in solution can be measured by the conductivity of the solution, which is proportional to the electric current conducted through the solution. The conductivity of both plasma and the dialysate is influenced primarily by the concentration of sodium and chloride and will change with perturbations of these solutes.67,114 The clearance of a solute by the dialyzer is equal to its dialysance when the solute is present only in the blood and is absent in the dialysate. The collective dialysance of small-molecular-weight ions (such as sodium) is considered equivalent to the dialysance of urea, and consequently ionic dialysance can be used as a reasonable surrogate for the dialysance of urea. In conventional single-pass hemodialysis, circuits in which the dialysate contains no urea, urea dialysance becomes equal to urea clearance, and ionic dialysance becomes an acceptable predictor of the urea clearance of the dialyzer, Kd-urea. Analogous to measurement of blood-based dialyzer clearance, ionic dialysance is computed from measurements of dialysate conductivity (concentration of ionic solutes) at the inlet and outlet ports of the dialyzer in response to transient changes in inlet dialysate conductivity and the instantaneous dialysate and blood flow rates.*
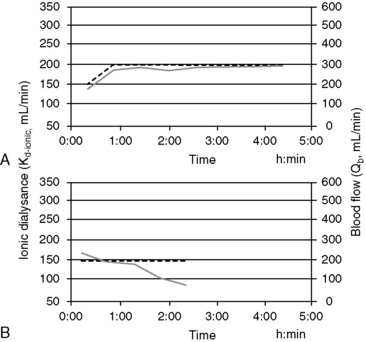
Sudden or progressive decreases of Kd-ionic during the treatment can alert possible clotting in the dialyzer or development of access recirculation that may compromise the adequacy of the treatment. It is also possible to make interim projections of the ionicKt/V for the session to ensure the treatment targets will be met by the end of the scheduled session time. If therapeutic targets will not be met under current circumstances, adjustments to treatment time, blood flow, and dialysate flow, access repositioning, or dialyzer exchange can be initiated to modify the forecast treatment to ensure adequacy.29
Routine animal hemodialysis is provided intermittently three times weekly based on human convention. As for humans, this schedule represents a compromise between clinical benefits, time constraints, and financial burden. However, recent experience in human patients with daily dialysis schedules has demonstrated marked theoretical and clinical benefits to the increased dialysis frequency.† Because diffusion is a first order process, dialysis becomes more efficient as the frequency of dialysis increases.28,46,66,99 Critical analysis of varying dialysis schedules has shown the total weekly dose calculated as the sum of the individual treatments is not equivalent among dialysis schedules with differing frequencies. Daily treatment schedules have equivalent clinical outcomes to traditional three times a week hemodialysis schedules even when delivered at a lower total weekly dose. For example, six treatments per week at a spKt/V of 1.0 per treatment are more efficient than three conventional treatments per week with a spKt/V of 2.0 per treatment. To reconcile these differences, the concept of standard Kt/V (stdKt/V) has been proposed to compensate for the differences in efficiency when comparing schedules with different intermittence.50,64–6699 Standard Kt/V is an hypothetical continuous urea clearance that would achieve a constant blood urea concentration identical to the average predialysis urea concentration for all intermittent treatments provided during the week. This theoretical concept allows comparisons among dialysis schedules with differing dialysis times and intervals, including the extreme case of continuous therapy.
A dialysis schedule with three 4-hour treatments per week with a spKt/V of 2.0 per treatment is equivalent to a stdKt/V of 2.7. Increasing the schedule to six 2-hour treatments per week (spKt/V, 1.0 per treatment) with the same total 12 hours of weekly dialysis substantially increases the amount of dialysis delivered to the equivalent stdKt/V of 3.9 (Appendix, Equation 12). Stated differently, a three times a week, 240-minute treatment schedule (stdKt/V, 2.7) requiring 12 hours of treatment could be provided with equivalent efficacy by considerably shorter treatments of 70 minutes per session if provided six times weekly for a total weekly dialysis time of 7 hours. Although reduction of the individual treatment time is possible according to this analogy and for illustrative purposes, this recommendation would not be clinically prudent.52,55,66,113 Conversely, decreasing the frequency of dialysis to two treatments per week would require extension of each treatment to almost 24 hours to achieve an equivalent stdKt/V. These quantitative predictions illustrate the marked benefits to increased frequency of therapy and are in accordance with recent clinical observations, suggesting it is difficult to compensate for decreased frequency of therapy with longer treatment times.47,50,172
As an alternative to sdtKt/V for comparing the equivalency of intermittent and continuous therapies, including residual renal function, the intermittent kinetics of hemodialysis can be converted to a continuous equivalent clearance (EKR).25,28,50,183,186 This concept is more intuitive for most clinicians as the relative contribution of dialysis can be compared directly with residual renal function and with other intermittent or continuous dialytic therapies (Appendix, Equation 7). Total patient clearance (renal clearance, Kr, and dialyzer clearance, EKR) is expressed in the familiar term (milliliters per minute) of clearance, similar to the glomerular filtration rate, and the resulting total clearance can be used to predict the expected uremic morbidity, similar to patients with earlier stages of chronic kidney disease.
A prerequisite for the validity of most urea kinetic modeling algorithms is the presumption of steady-state urea metabolism (i.e., constant food intake (quality and quantity), constant endogenous nitrogen metabolism and catabolism, stable body weight, and a regular dialysis schedule).48 These conditions rarely exist for most veterinary applications of hemodialysis that are prescribed for acute kidney failure; however, classic double-pool, equilibrated, and EKR analyses appear valid under these conditions in human patients if careful attention is paid to the accuracy of all input variables.26,44,87
The rationale to scale dialysis dose to the nebulous index (V) that cannot be readily measured has kinetic justification and historical acceptance. The first order kinetics of urea removal by dialysis proceeds with an elimination constant equal to Kd/V and is a measure of the intensity of the treatment. Even though V is not measured directly, it is derived mathematically to yield the expression, Kt/V, with kinetic modeling. Recently, however, the universality of scaling dialysis dose to the urea distribution volume has been questioned in human patients as the relative distribution volume varies independently of body size, between genders, and in patients of differing body composition.43 Consequently, scaling dialysis dose to V may promote under treatment in some individuals and relative overtreatment in others. The comparative significance of this issue has not been addressed in animals, but it is likely the diversity of size, species, and breed, in addition to gender, in animal patients that could impose even greater variance in the relative urea distribution volume than seen in humans.
The effect of dose of dialysis on outcome has been demonstrated in humans with end-stage chronic kidney disease in several large-scale clinical studies.* The dose of dialysis that is adequate to manage dogs and cats with either acute or chronic kidney failure needs to be established using appropriate tools for treatment quantification. However, until these parameters are established, routine application of UKM extends therapeutic insights of dialysis delivery far beyond reliance on routine chemistry tests and clearly benefits the assessment and clinical management of uremic animals. Kinetic parameters and quantitation of dialysis delivery are important tools for quality assurance of dialytic therapy in animals; however, they are not therapeutic goals per se.186 The provision of a yet-to-be-defined minimal dose of dialysis is only one of the requirements of therapeutic adequacy, and management of uremia necessitates an individually tailored global approach to the animal.
Use of hemodialysis to correct uremia
The major application of dialytic therapy is the transient elimination of innumerable and unspecified solutes and fluid retained during renal failure that would otherwise be cleared by healthy kidneys. The benefits of intermittent dialysis are transient, and with cessation of dialysis, the concentrations of urea and all retained uremia solutes with continued generation increase immediately until a new steady state is achieved or until the next dialysis session (Figures 29-1 and 29-3). It is firmly established that uremia is associated with retention of a myriad of low-molecular-weight solutes that are effectively predicted by the blood urea concentration; dialytic removal of these solutes to minimize the time-averaged urea concentrations mitigates the associated morbidity and mortality of uremia but does not resolve all uremic symptomatology.* It is equally established that additional classes of retention solutes including protein-bound, low-molecular-weight solutes, secluded solutes, and so called middle molecules with a molecular weight between 500 Da and 60,000 Da are poorly dialyzed by conventional high-flux diffusive and hemofiltration techniques, limiting the efficacy of extracorporeal techniques.† The diffusive removal of urea and small-molecular-weight solutes is exceptionally efficient in animals because of their small size (volume) relative to the surface area and clearance capabilities of the hemodialyzer. Theoretically, these solute and the fluid abnormalities attending uremia could be corrected temporarily during a single hemodialysis session, but clinical sequelae associated with abrupt excursions in the solute and fluid content of the patient limit the rate and magnitude that they can be altered. The change in solute concentration (e.g., urea) during dialysis is influenced by the size of the animal and the interactive parameters defining the dialysis prescription (see Appendix, Equation 8). The intensity of dialysis can be adjusted by altering blood flow rate (Qb), dialysate flow rate (Qd), clearance of the hemodialyzer (Kd), rate of ultrafiltration (UF), or length of the dialysis session (Td) to accommodate the size and therapeutic needs of the animal. After dialysis, BUN (and other retained uremia solutes) increases in proportion to urea generation from dietary nitrogen and endogenous protein catabolism (G) and inversely with residual renal function (Kr) (see Figures 29-1 and 29-2). Higher dietary protein intake, increased catabolism, and lower residual renal function will produce a steeper increase and higher steady-state concentration of urea after dialysis unless interrupted by an intervening dialysis treatment before achieving a steady state (Figure 29-2). The peak predialysis urea, time-averaged urea concentrations, and the exposure to urea and other uremic toxins will be lower the more frequently and effectively a patient is dialyzed.46,48,50,64,186
The hemodialysis session is defined by the dialysis prescription, which is formulated interactively with consideration of the physical and clinical condition of the patient and the alterations of body fluid volume and composition subject to dialytic correction. The prescription must accommodate the physiologic, hematologic, and biochemical status of the patient before dialysis and target the desired modifications at the end of the session (Box 29-2). Patient assessment includes (1) species, breed, weight; (2) degree of azotemia; (3) hemodynamic stability and predisposition to hypotension and hypovolemia (i.e., body weight, estimated blood volume, blood pressure, volemic status); (4) hematocrit and total plasma solids; (5) electrolyte and acid-base abnormalities; (6) oxygenation capacity; and (7) bleeding potential. The prescription is individualized for each patient and every dialysis session by selecting dialytic options that best achieve the solute removal and ultrafiltration goals of the session without predisposing therapeutic risk. Specific factors regulating these processes are prescribed independently and are outlined in Box 29-3. Hemodialysis prescriptions for animals have been derived empirically as consensus-based guidelines for a diverse array of animal types and clinical conditions. There has been little validation or standardization of dialysis therapy based on outcome assessment. However, animal dialysis has advanced over the past 40 years, and dialysis prescriptions are based on a solid understanding of the physical and physiological principles governing dialysis and clinical aspects of uremia.
Box 29-2 Clinical Considerations Influencing the Hemodialysis Prescription
1. Patient characteristics (species, size, age, body condition)
2. Severity of the azotemia and retained uremic toxins
3. Electrolyte and mineral disorders: sodium, potassium, chloride, bicarbonate calcium, magnesium, and phosphate
4. Acid-base imbalances and depleted or deficient solutes: bicarbonate, calcium, glucose
5. Exogenous intoxications (e.g., ethylene glycol)
6. Hydration status and fluid balance
7. Physiologic disturbances: blood pressure, body temperature, oxygenation, change in body weight, mental state
9. Medications, surgical history, and comorbid clinical conditions
Box 29-3 Components of the Hemodialysis Prescription
1. Selection of the hemodialyzer (surface area, bundle volume, solute and ultrafiltration characteristics, hemocompatibility, and biocompatibility)
2. Selection of extracorporeal circuit and priming solution
4. Dialysis time (Td) and scheduled bypass time
5. Dialysate composition and/or modeling
6. Dialysate flow rate and direction (Qd)
8. Access connection (“single needle,” reversed direction)
9. Anticoagulation (anticoagulant, target ACT, protocol)
10. Ultrafiltration (volume target, rate)
13. Rinse back (solution, volume, air)
Hemodialysis prescription for acute kidney injury (AKI)
Hemodialyzers
Selection of the hemodialyzer is based initially on its contribution to the extracorporeal volume and secondarily on its diffusive, convective, and biocompatibility properties according to guidelines in Table 29-1. The smallest neonatal hemodialyzer currently available has a 0.3 m2 surface area and a 28-mL blood volume compartment (F3, Fresenius Medical Care, Waltham, Mass.). For cats and dogs weighing less than 6 kg, a dialyzer with a surface area between 0.2 and 0.4 m2 and a priming volume less than 30 mL generally is tolerated. A synthetic dialyzer (neonatal or pediatric) with a surface area between 0.4 and 0.8 m2 and a priming volume less than 45 mL is appropriate for use in dogs weighing between 6 and 12 kg of body weight. Dialyzers with surface areas up to 1.5 m2 and priming volumes up to 80 mL can be used on dogs between 12 and 20 kg of body weight. Larger dialyzers with surface areas greater than 2.0 m2 and priming volumes greater than 100 mL can be used in dogs weighing more than 30 kg.
Table 29-2 Treatment Intensity Prescription
| Initial Treatment | |
| BUN <200 mg/dL | URR <0.5 at no greater than 0.1 URR/hr |
| 200-300 mg/dL | URR 0.5-0.3 at no greater than 0.1 URR/hr |
| >300 mg/dL | URR ≤ 0.3 at no greater than 0.05-0.07 URR/hr |
| Second Treatment | |
| BUN <200 mg/dL | URR 0.6-0.7 at 0.12-0.15 URR/hr |
| 200-300 mg/dL | URR 0.6-0.4 at no greater than 0.05-0.1 URR/hr |
| >300 mg/dL | URR ≤ 0.4 at no greater than 0.05-0.1 URR/hr |
| Third and Subsequent Treatments | |
| BUN <150 mg/dL | URR >0.8 at >0.15 URR/hr |
| 150-300 mg/dL | URR 0.5-0.6 at 0.15-0.1 URR/hr |
| >300 mg/dL | URR 0.5-0.6 at <0.1 URR/hr |
Treatment Intensity
Initial dialysis treatments are prescribed to be less intensive (slower blood flow rate, smaller dialyzer surface area, and possibly shorter treatment time) than those prescribed for subsequent treatments. At slow blood flow rates, urea extraction across the dialyzer approaches 100%, and urea clearance (Kd-urea, in milliliters per minute) is approximately equal to extracorporeal blood flow (Qb, in milliliters per minute). When high-efficiency and high-flux dialyzers are used, Kd-urea increases quantitatively with Qb until blood flow exceeds 200 mL/min.47 At blood flow rates above 200 mL/min, the relationship flattens as urea clearance is influenced by membrane characteristics and dialysate flow in addition to Qb.47 At blood flow rates greater than 300 mL/min, dialyzer performance is influenced minimally by increased single-pass flow, but total solute removal during the treatment will increase as a function of the cumulative flow through the dialyzer. The total volume of blood passed through the dialyzer during the treatment (Qb × Td) has been established as a reasonable predictor of the intensity of the treatment as estimated by the URR (Figures 29-3 and 29-4).34,59,96 This relationship can be used as an operational parameter to guide the prescription and delivery of dialysis to the target URR for differing severities of uremia and phases of management (Table 29-2).
Dialysis Time
Once the target URR is defined for the treatment, the approximate volume of blood requiring dialytic processing to achieve the goal can be determined (Figures 29-3 and 29-4). From this volume (Qb × t), appropriate combinations of blood flow rate (Qb) and dialysis time (t) can be derived. For patients with moderate to severe azotemia, a long dialysis session time (slow Qb) is preferable to a short session time (fast Qb) that yields the same volume of processed blood and prescribed URR. Prescription of a dialysis session time less than 180 minutes could promote use of inappropriate blood flow rates that induce rapid changes in BUN and life-threatening dialysis complications. Short treatments usually cause inadequate URR outcomes that delay resolution of the azotemia. A patient with an initial BUN concentration of 250 mg/dL treated for 120 minutes to yield a URR of 0.2 (0.1 URR/hr, postdialysis BUN, 200 mg/dL) may rebound to a BUN approaching 250 mg/dL by the next treatment. The subsequent treatment will be constrained by the same concerns for rapid urea reduction and dialysis disequilibrium at issue for the initial treatment because no progress was made to resolve the azotemia. A safe and more effective approach for initial treatments is to prescribe extended-slow dialysis to target a URR between 0.4 and 0.5 (or more) over 4 to 8 (or more) hours. Once the predialysis BUN is less than 150 mg/dL, dialysis time can be maintained or increased in both dogs and cats concurrent with faster blood flow rates to achieve higher URRs.
The hourly URR can be used as an additional guide to determine the appropriate treatment time. An excessive rate of urea reduction is more likely to cause intradialytic complications than the absolute decrease in BUN over the dialysis session.96 The risk of dialysis disequilibrium syndrome can be minimized by adherence to the hourly URR recommendations as indexed to the degree of azotemia in Table 29-2. With these guidelines, an appropriate treatment time can be determined readily by dividing the URR goal for the treatment by the designated hourly URR. Animals become more tolerant to rapid urea shifts as their azotemia is reduced and as the number of dialysis treatments is increased. More aggressive hourly URR goals can be prescribed beyond the initial two to three treatments at a later stage of management. It should be emphasized that URR is determined cumulatively over the entire dialysis treatment, but the rate and absolute change in serum urea and osmolality will be highest at the beginning of the treatment. Despite appropriate URR prescription for the treatment, hourly URR recommendations could exceed safe guidelines at the beginning of the treatment in extremely azotemic animals if the URR goal is too high or the treatment time is short.
Extended slow dialysis treatments also facilitate removal of large volumes of fluid that risk volume contraction and hypotension during shorter treatments. Treatment intensity is indexed to urea transfer, which occurs faster than solutes (e.g., potassium, phosphate, and creatinine) that are less diffusible or compartmentalized and poorly transferable. Longer treatments enhance removal of urea in addition to secluded solutes that do not behave like urea.55,63,113
Extracorporeal Blood Flow
Blood flow is a major determinant of treatment intensity and becomes defined in sequence as the URR goal; required volume of processed blood and treatment time are decided. For a 20 kg dog with AKI and a BUN of 295 mg/dL, a URR of 0.4 (40%) might be prescribed. The requisite treatment volume for this target would be 0.4 L/kg or 8 L of total treatment (see Table 29-2; Figure 29-3). Appropriate combinations of dialysis time and blood flow rate are next computed to achieve the 8 L goal. For a 240-minute dialysis session time (0.1 URR/hr), the required Qb would be 33 mL/min (i.e., 8000 mL/240 minutes; 1.7 mL/kg/min), whereas for a 360-minute session time (0.06 URR/hr), the required Qb would be 22 mL/min (1.1 mL/kg/min). A higher first treatment URR target could be selected with appropriate extension of the treatment time to maintain a safe hourly URR.
For severely uremic cats or small dogs with BUN concentrations greater than 250 mg/dL, it is preferable to extend the treatment time to greater than 5 hours while providing exceptionally slow blood flow and urea clearance rates to deliver a sufficiently gradual target of <0.1 URR/hr. In some cases, it may not be possible to adjust the pump speed sufficiently to deliver a blood flow rate slow enough to correct the azotemia safely. For example, a 4 kg cat with an initial BUN of 330 mg/dL would require approximately 1.2 L of blood processing to achieve a treatment URR of 0.4 (or 40%) (Figure 29-4). If the treatment were delivered safely over 360 minutes (0.07 URR/hr), the required Qb would be 3.3 mL/min. The dilemma is most dialysis machines cannot deliver accurately a blood flow at this low rate. A faster Qb will intensify the treatment and shorten the time to treatment goal unacceptably. At a Qb of 10 mL/min (which is still too slow for many machines), the treatment time would be only 120 minutes (0.2 URR/hr) and unsafe for the target URR. In these circumstances, it is possible to extend the treatment time and lower the effective Qb by alternating periods of active dialysis with deliberate intervals of bypass in which blood flow continues but dialysate flow and hence dialysis are stopped. There is some continued diffusion into the dialysate contained in the dialyzer as the system is placed in bypass, but generally, alternating 5 to 10 minutes of dialysis with 5 to 20 minutes of bypass decreases the effective Qb and hourly URR, and extends the time to treatment goal by twofold to fourfold. Ultrafiltration continues during the bypass, facilitating fluid removal during the extended treatment time. Blood flow can be increased during the bypass intervals to minimize clotting in the extracorporeal circuit without the risk of excessive dialysis.
Stay updated, free articles. Join our Telegram channel

Full access? Get Clinical Tree


