2 Endocrine and metabolic physiology
Neuroendocrine regulation of appetite and energy balance
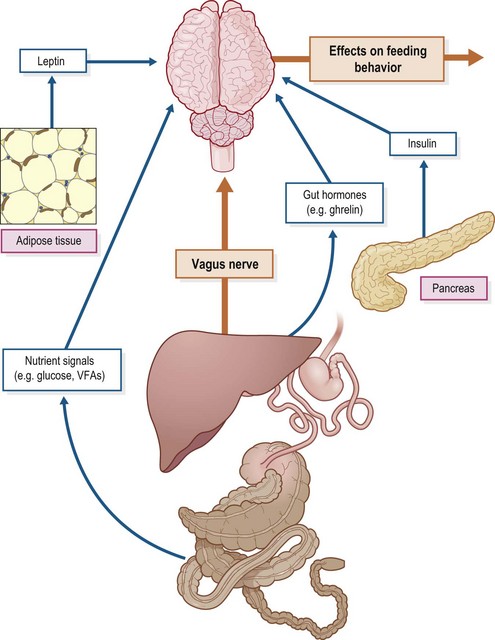
The central nervous system (CNS) modulates energy balance by regulating feed intake and energy expenditure in response to hormonal, neuronal and nutrient signals (Schwartz et al 2000; Fig. 2.1). In humans and other mammals, regulatory processes within the arcuate nucleus of the hypothalamus control feed intake and energy expenditure. Agouti-related peptide/neuropeptide Y (AgRP/NPY) neurons stimulate appetite (orexigenic hormones) and decrease metabolism, while proopiomelanocortin (POMC) neurons release α-melanocyte-stimulating hormone (α-MSH), a neurotransmitter that inhibits food intake (Schwartz et al 2000). A large number of hormones secreted by other tissues in particular the gut and adipose tissue as well as various nutrient signals, interact with these hypothalamic neurons to modulate appetite and metabolic rate. For example, peptide YY3–36, a hormone secreted by the gut in direct proportion to the caloric content of a meal, decreases the activity of AgRP/NPY neurons and consequently suppresses appetite and food intake in rodent species (Murphy & Bloom 2006).
Very little information is available regarding the neuroendocrine control of energy balance in horses, although some data has emerged in recent years with respect to the hormones known to contribute to the control of appetite and energy homeostasis in other animals (e.g., leptin, adiponectin and ghrelin). The following sections briefly describe the functions of these key hormones and summarize the available equine data. Earlier work that investigated the effect of nutrient signals on feeding behavior in horses is also discussed. A more complete discussion on the more general factors affecting feed intake is presented in Chapter 3.
Leptin
Leptin is an adipocyte-derived hormone product of the ob gene that provides information to the brain (arcuate nucleus of the hypothalamus) regarding the availability of body fat stores, promoting satiety and reduction in food intake when energy balance is positive or fat stores are plentiful (Spiegelman & Flier 2001). Both AgRP/NPY and POMC neurons in the arcuate nucleus express leptin and insulin receptors, and the direct administration of either hormone into the brain of rodents reduces food intake (Schwartz et al 2000). The appetite suppressant effect of leptin is in part mediated by an increased expression of melanocortins, such as α-MSH, that induce satiety (see below). Leptin stimulates metabolism and energy expenditure by several mechanisms; it activates the sympathetic system in brown adipose tissue and increases the expression of uncoupling protein-1 and uncoupling protein-3 in skeletal muscle (Giacobino, 2002). Leptin also stimulates triglyceride and fatty acid metabolism by increasing lipolysis and fatty acid oxidation.
Leptin is secreted by adipocytes in proportion to their fat content, and therefore is an important signal to the brain regarding long-term energy stores. This importance is highlighted by the profound obesity that develops in animals with deletion of either the leptin protein or its receptor (Morton et al 2003). Increased fat stores and the resulting increased leptin secretion suppress appetite and increase metabolism (Schwartz et al 2000) but this feedback mechanism may fail beyond a certain level of adiposity. Indeed, obesity is associated with a marked increase in circulating leptin suggesting the development of leptin resistance (Considine et al 1996).
Studies in horses have shown a positive association between circulating leptin concentrations and BCS (Buff et al 2002, Carter et al 2009). Some studies, however, have shown a wide range of serum/plasma leptin concentrations in horses with similar apparent adiposity (Gentry et al 2002), suggesting that factors other than adipose tissue mass affect leptin production and secretion. Higher plasma leptin concentrations were reported in fed horses compared with fasted horses, with higher values in the afternoon than the morning being found only in the fed horses (Buff et al 2006). Plasma leptin concentration decreases in response to short-term feed restriction (McManus & Fitzgerald 2000, Van Weyenberg et al 2008) and increases following meal feeding (Cartmill et al 2005). The insulin increase associated with meal feeding appears to drive the postprandial increase in plasma leptin (Cartmill et al 2005). Dexamethasone administration has also been shown to be a potent stimulator of leptin secretion in horses, whereas physiological elevation of cortisol concentrations following adrenocorticotropic hormone (ACTH) administration produced only minor increases in leptin (Cartmill et al 2005). Leptin has seasonal variations in young and old mares, with plasma leptin levels increasing in the summer and decreasing in the winter, in correlation with body weight and fat mass (McManus & Fitzgerald 2000). Taken together, these observations suggest that leptin contributes to energy homeostasis in horses but its role in appetite regulation remains to be determined.
Insulin and glucose
Insulin crosses the blood–brain barrier and its receptors are found throughout the brain, with high concentrations observed in the arcuate nucleus of rodents (Bruning et al 2000). The intraventricular administration of insulin decreases feed intake in rats, partly due to an associated decrease in hypothalamic NPY and an increase in POMC expression (Sisley & Sandoval 2011). Glucose sensing in the brain also contributes to the regulation of feed intake, although the weight of evidence suggests that glucose availability is permissive to anorectic signals rather than glucose per se playing a primary role (Sisley & Sandoval, 2011). Ralston and Baile (1982a,b) investigated the effects of oral and intravenous glucose loads on feeding behavior in ponies. The intragastric administration of glucose (300 g) delayed the onset of feeding by ~113 min, with normal feeding behavior evident once the glucose-treated animals started to eat. This glucose effect on feeding was dose-related, with a shorter delay (latency) until the onset of feeding being observed after administration of 100 or 200 g glucose (Ralston & Baile, 1982b). On the other hand, IV glucose loads (0.2 or 1.0 g/kg BW) that induced marked hyperglycemia and hyperinsulinemia did not delay the onset of feeding but tended to prolong the interval between the first and second meal, suggesting an effect on satiety (Ralston & Baile 1982a). Further research is needed to clarify the effect of glucose and insulin signals on feeding behavior in horses.
Other nutrient signals
Ralston and Baile (1983) also compared the effects of intragastric corn oil (133 g) or mineral oil (133 g) on feeding behavior in ponies. Corn oil did not alter the onset of feeding or the size or duration of the first meal relative to control values. However, as observed with IV glucose administration, corn oil prolonged the first inter-meal interval and feed intake between 3 and 18 h post oil administration was 50% lower relative to the mineral oil (control) treatment (Ralston & Baile 1983). The mechanism(s) of this response was not investigated although in other species it is recognized that increased long-chain free fatty acids suppress food intake (at least in healthy, nonobese individuals) (Sisley & Sandoval 2011).
In ruminants, the infusion of volatile fatty acids (VFAs) into the rumen depresses feed intake. With the exception of propionate, however, this outcome seems to be due to the resultant increase in osmolality of rumen constituents vs. signaling by VFAs to central nervous system appetite centers because the injection of local anesthetics into the rumen eliminates the effects of acetate and butyrate infusions on feed intake (Faverdin 1999). In humans too, there is some evidence that propionate mediates satiety (Arora et al 2011). One study in ponies demonstrated that the intracecal infusion of 0.4 mmol propionate/kg BW increased feed intake by 7.5% relative to control values, while acetate (1.0 and 1.25 mmol/kg BW) and higher doses of propionate (0.75 mmol/kg BW) decreased feed intake by substantially prolonging the first inter-meal interval (Ralston et al 1983). Ralston and colleagues suggested that oropharyngeal stimuli have a dominant role in the short-term control of feed intake of ponies, whereas nutrient cues (e.g., glucose, VFAs) may be important in the regulation of meal frequency and long-term energy balance.
Ghrelin
Ghrelin is secreted by the hypothalamus and, in particular, P/D1 cells of the stomach. In humans, plasma ghrelin concentrations increase during the preprandial period and the magnitude of the increase is correlated with hunger scores (Cummings et al 2004). Intravenous infusion of ghrelin induces hunger and food intake in people (Korner et al 2009). For this reason, ghrelin is sometimes referred to as the “hunger hormone”. In addition, to its orexigenic effect in humans, ghrelin stimulates gastrointestinal motility, gastric acid secretion and pancreatic exocrine secretion, all of which increase in anticipation of meals (Delzenne et al 2010). In horses, plasma ghrelin decreases in response to oral and intravenous glucose administration (Gordon & McKeever 2006). Feed intake and plasma ghrelin concentrations were higher in horses subjected to interval exercise vs. the control (no exercise) condition (Gordon et al 2006). These observations suggest that plasma ghrelin responds to nutritional signals and may play a role in appetite regulation in horses.
Melanocortins
The appetite suppressant effect of leptin is in part mediated by increased expression of melanocortin peptides, such as α-MSH and ACTH. In rats, under physiological conditions, there is evidence that both α-MSH and ACTH inhibit food intake by signaling through melanocortin-4 receptors that are located in several areas of the hypothalamus (Schulz et al 2010). Horses, similar to other species including sheep, demonstrate a seasonal rhythm in circulating concentrations of α-MSH and ACTH, with higher concentrations in the fall (autumn) than in winter and spring (Lincoln et al 2001, McFarlane et al 2011). In nondomesticated horses adapted to temperate climates, there are several other physiological adaptations that are entrained to photoperiod, including a decrease in appetite and metabolic rate as winter approaches (Fuller et al 2001). It is possible that the increases in α-MSH and ACTH contribute to this decrease in appetite in the fall.
Key Points –
Neuroendocrine control of appetite and energy balance
• The central nervous system modulates energy balance by regulating feed intake and energy expenditure in response to hormonal, neuronal and nutrient signals.
• In horses, nutrient cues (e.g. increases in circulating glucose, insulin and volatile fatty acids) may modify aspects of feeding behavior in the short-term.
• The seasonal rhythm in circulating concentrations of α-MSH (melanocyte stimulating hormone) and ACTH (adrenocorticotrophic hormone) may contribute to longer-term regulation of feed intake and energy balance.
Endocrine regulation of metabolism
Hormones of the endocrine pancreas
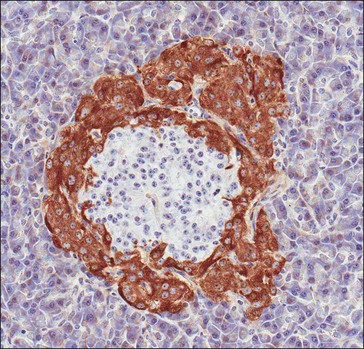
The endocrine functions of the pancreas are mediated by cells of the islets of Langerhans (Fig. 2.2) that play a central role in systemic fuel homeostasis via secretion of hormones that directly influence the metabolic pathways involved in the uptake, deposition and utilization of fuel substrates. The two most important hormones in this context are insulin (synthesized and secreted by beta-cells) and glucagon (released by alpha-cells); a third major cell type (delta-cells) produces somatostatin, a hormone that suppresses insulin secretion, intestinal blood flow and nutrient uptake. Immunohistochemical studies have identified all three cell types in equine pancreatic islets (Furuoka et al 1989).
In general, insulin and glucagon are secreted in a reciprocal manner in response to changes in the plasma concentrations of glucose and other metabolites. Insulin secretion occurs postprandially and favors the uptake of glucose and fatty acids in skeletal muscle, liver and adipose tissue. In the post-absorptive state, insulin secretion is reduced and glucagon secretion is enhanced, which results in stimulation of catabolic processes including the mobilization of glucose and fatty acids (Moore et al 2003). The actions of insulin and glucagon ensure that blood glucose concentrations are maintained within a fairly narrow range.
Insulin
Insulin is a pleiotropic hormone with numerous effects at the cellular, tissue, and whole-body level – indeed, it is now recognized that every organ in the body is a target for insulin action (Wilcox 2005). Insulin is primarily known for its role in carbohydrate metabolism, including the stimulation of glucose uptake and glycogen synthesis in skeletal muscle as well as suppression of glucose production (inhibition of glycogenolysis and gluconeogenesis) from the liver. Other metabolic effects of insulin include stimulation of triglyceride synthesis, inhibition of the release of free fatty acids from adipose tissue, and stimulation of the incorporation of amino acids into proteins (Wilcox 2005) (Table 2-1). Insulin also promotes cell division and growth through its mitogenic effects.
Table 2-1 General Anabolic Effects of Insulin on Carbohydrate, Lipid and Protein Metabolism in Mammalian Species
Increased rate of glucose transport across the cell membrane in muscle cells and adipocytes
Stimulation of glycolysis in muscle and adipose tissue via activation of hexokinase and phosphofructokinase activity
Stimulation of glycogen synthesis in liver, adipose tissue and muscle
Inhibition of glycogenolysis and gluconeogenesis in liver; inhibition of glycogenolysis in muscle
Decrease in the rate of lipolysis in adipose tissue, which results in a decrease in plasma or serum nonesterified fatty acids
Stimulates fatty acid and triacylglycerol synthesis in tissues
Increases the uptake of triglyceride from the blood into adipose tissue and muscle via activation of the enzyme lipoprotein lipase
Decreases the rate of fatty acid oxidation in muscle and liver
Increases cholesterol synthesis and very low density lipoprotein formation in liver
Schmidt & Hickey 2009, Dimitriadis et al 2011.
Insulin secretion
Insulin is a dipeptide containing A and B chains linked by disulfide bridges. Synthesis within beta-cells begins with the formation of preproinsulin, which is comprised of a signal peptide, the B chain, the connecting peptide (C-peptide) and the A chain (Wilcox 2005). Removal of the signal peptide in the endoplasmic reticulum forms proinsulin which is transported to the Golgi apparatus and then incorporated into soluble, zinc-containing hexamers (Wilcox 2005). Within secretory granules proteolytic removal of C-peptide from proinsulin yields insulin; this process allows a conformational change in the carboxy terminal of the B-chain of the insulin molecule that facilitates interaction with the insulin receptor (Wahren et al 2000). Insulin and C-peptide are co-secreted in equimolar amounts when mature granules release their contents into the portal circulation (Wilcox 2005). The effects of exogenous somatostatin, glucose infusion and insulin resistance on serum C-peptide concentrations in the horse have been described (Tóth et al 2010). Endogenous C-peptide secretion was markedly suppressed by somatostatin, while the C-peptide-to-insulin ratio decreased during an intravenous glucose tolerance test (300 mg dextrose/kg BW) from 3.60 ± 1.95 before injection to 1.03 ± 0.18 at 20 min after dextrose administration. The latter observation suggests that relative insulin clearance decreases as insulin secretion increases in response to dextrose administration. Median C-peptide and insulin concentrations were 1.5- and 9.5-fold higher, respectively, in insulin resistant horses when compared to healthy control animals (Tóth et al 2010). This perhaps reflects both increased insulin secretion and decreased insulin clearance in insulin resistant animals (Tóth et al 2010). The liver is the primary site of insulin clearance with up to two-thirds of the insulin secreted into the portal vein removed by first-pass hepatic metabolism (Wilcox 2005).
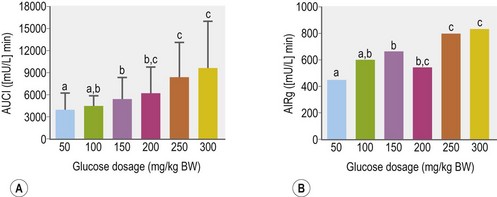
Glucose is the primary stimulus for insulin secretion, although other macronutrients (e.g., amino acids, lipids, and volatile fatty acids), hormones (e.g., glucagon-like peptide-1 [GLP-1] and somatostatin), humoral factors and neural input may modify the insulin secretory response (Pørksen et al 2002, Wilcox 2005 – see Table 2-2). In horses, a linear relationship between intravenous (IV) glucose dose and apparent insulin secretory response has been observed (Tóth et al 2009; Fig. 2.3). In humans and rats, a biphasic pattern to insulin secretion is observed in response to a sustained increase in plasma glucose concentration. There is a rapid increase in secretion that lasts only a few minutes and results in a well-defined peak in insulin concentrations, followed by a nadir and then a longer secondary phase of increased secretion that requires the augmenting action of glucose (Henquin et al 2002, Seino et al 2011). The first phase of secretion reflects rapid release of insulin from granules close to the cell membrane of beta-cells (readily releasable pool), while mobilization of the reserve pool of granules as well as newly synthesized insulin accounts for the second phase (Seino et al 2011). Some (Giraudet et al 1994, Tóth et al 2009) but not all (Dühlmeier et al 2001) studies in horses have reported that insulin secretion appears to occur as a single phase rather than as a biphasic response.
Table 2-2 Nutrient, Hormonal and Neural Mediators of Insulin Secretion in Mammals
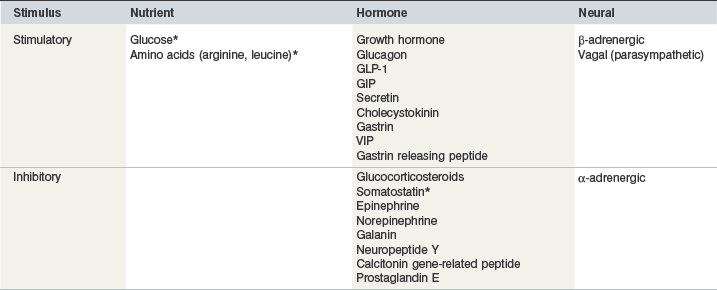
Asterisk indicates that direct evidence exists in horses.
Pancreatic beta-cells are responsive to amino acids, including arginine, leucine and alanine (Wilcox 2005). The insulinotropic effect of arginine involves direct depolarization of the beta-cell plasma membrane (Sener et al 2000), whereas leucine-induced insulin secretion involves allosteric activation of glutamate dehydrogenase and an increase in adenosine triphosphate (ATP) production that leads to membrane depolarization (Heissig et al 2005). Arginine administration induces an insulin secretory response in fetal and neonatal foals (Fowden et al 2012) as well as mature horses (Sticker et al 2001). Leucine potentiates the insulin response to oral glucose administration in horses (Urschel et al 2010, Bröjer et al 2012). Both at rest and after a 60 min bout of exercise, the coadministration of glucose (1 g/kg BW) and leucine (0.3 g/kg BW) resulted in a greater than twofold increase in the area under the plasma insulin response curve when compared to the administration of glucose (1 g/kg BW) alone (Urschel et al 2010). The addition of lower amounts of leucine (0.05, 0.1 or 0.2 g/kg BW) to a base feed, however, did not alter insulinemic responses in Quarter Horse yearlings (Etz et al 2011). Neither aspartic or glutamic acid nor N-methyl-D,L-aspartate affected insulin secretion in mature horses (Sticker et al 2001). The IV administration of butyrate but not acetate or propionate (all at 3.5 mmol/kg BW) elicited a modest insulin response in ponies (Argenzio & Hintz 1971); these responses are different to those reported for ruminants where IV propionate, butyrate and valerate are more potent stimulators of insulin secretion than glucose (Horino et al 1968).
The presence of nutrients in the gastrointestinal tract stimulates the secretion of hormones that augment glucose-induced insulin secretion (Kazakos 2011). In humans, it is well recognized that an oral glucose load results in a greater insulin response than that of an isoglycemic intravenous glucose infusion; this response is known as the incretin effect (Kazakos 2011, Irwin & Prentice 2011). This difference in insulin response is primarily attributed to the gastrointestinal peptides glucose-dependent insulinotropic polypeptide (GIP) and glucagon-like peptide-1 (GLP-1) – the so-called incretin hormones. In humans and other monogastric species, GIP is synthesized in enteroendocrine K cells in the proximal small intestine, whereas GLP-1 is synthesized in enteroendocrine L cells in the distal ileum and colon (Irwin & Prentice 2011). As much as two-thirds of the insulin secreted in response to meal ingestion in humans is due to the insulinotropic action of GIP and GLP-1 (Kazakos 2011). The extent to which these hormones contribute to insulin secretion in response to glucose administration or feed ingestion in horses is not known. Active GLP-1 concentrations have been measured in horses, with no change observed after weight gain in animals with histories of obesity and insulin resistance (Chameroy et al 2011). Dühlmeier et al (2001) observed a significant increase in plasma immunoreactive GIP in ponies and horses in response to oral but not IV glucose administration. These authors also reported a greater insulin response after oral when compared to IV glucose administration but an incretin effect could not be confirmed due to a fivefold difference in glucose dose (oral > IV; Dühlmeier et al 2001).
Age and physiologic state affect insulin secretory responses in horses. Several studies have characterized beta-cell function in foals during fetal development and the 10-day period postpartum (Forhead et al 2004, Fowden et al 2005, Holdstock et al 2004, 2012). Glucose administration had no effect on fetal insulin secretion between 175 and 230 days of gestation. However, insulin secretory responses to glucose increased in magnitude between 260 and 300 days of gestation, with a further increment in response late in gestation that coincided with the prepartum rise in circulating cortisol concentrations (Fowden et al 2005). Two hours after birth, the insulin response to glucose administration was low when compared to late gestation or days 5–7 of age (Holdstock et al 2004, Fowden et al 2005, 2012). The authors hypothesized that elevated circulating catecholamines contributed to the suppressed insulin secretory response at 2 h of age (Fowden et al 2012). Overall, pancreatic beta-cell response to glucose or arginine is little changed between days 2 and 10 postpartum (Holdstock et al 2004). However, the induction of parturition 24–48 h before full term as well as adverse conditions in utero results in an apparent increase in beta-cell sensitivity to glucose (Forhead et al 2004, Holdstock et al 2012). Induced foals had a 2–3-fold higher beta-cell response to exogenous glucose and arginine when compared to spontaneously delivered foals; these responses in the induced foals were associated with hypercortisolemia and the authors speculated that the increased insulin secretion may have been due to a cortisol-induced insulin resistance (Holdstock et al 2012). Neonatal pony foals that were overgrown in utero by transfer of pony embryos into Thoroughbred mares also demonstrated an increased beta-cell response to glucose (Forhead et al 2004), perhaps due to enhanced beta-cell growth during fetal development (Allen et al 2002).
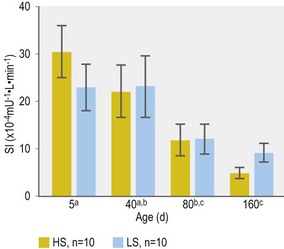
Further alterations in pancreatic beta-cell response during preweaning foal development have been less well studied. Smyth et al (1993) reported higher post-feeding serum insulin concentrations in 3-month-old Arabian and Thoroughbred foals when compared to responses measured at 1 day, 1 week and 1 month of age. However, interpretation of these responses was confounded by differences in meal composition. In addition, the extent to which changes in insulin response reflected actual changes in beta-cell response vs. a compensatory response to decreased tissue insulin sensitivity was not determined. In this context, George et al (2009) reported a substantial decrease in insulin sensitivity in Thoroughbred foals between 5 and 160 days of age (George et al 2009; Fig. 2.4).
An upregulation of beta-cell function has been reported during pregnancy in humans and rodents (Sorenson & Brelje 1997) and similar changes have been proposed to occur during pregnancy in mares although specific measures are lacking (Fowden et al 1980). George et al (2011) observed higher acute insulin response to glucose (AIRg) but also lower insulin sensitivity (SI) in pregnant when compared to non-pregnant Thoroughbred mares. Therefore, the higher apparent insulin secretory response could, at least in part, have been compensation for reduced tissue insulin sensitivity.
In humans, glucose tolerance progressively declines with age due to decreases both in tissue insulin sensitivity and beta-cell responsiveness (Chang & Halter 2003). In horses, insulin response to oral or IV glucose administration was higher in old (mean age 27 years) when compared to middle-aged (15 years) and young (7 years) Standardbred mares (Malinowski et al 2002); however, it could not be determined whether this greater insulin response was due to increased insulin secretion, decreased insulin clearance, or both.
Insulin secretion is suppressed during exercise (Wasserman et al 1995). In horses, a decrease in serum insulin concentration was observed at exercise intensities greater than 50% of maximum aerobic capacity (VO2max; McKeever 2002). There is a reciprocal increase in serum glucagon concentration and the rise in glucagon and fall in insulin, in part, mediate the increase in hepatic glycogenolysis during exercise. Exercise-induced increases in sympathetic drive and catecholamine release are thought to contribute to changes in insulin and glucagon secretion in the horse (Geor et al 2000a, b).
Insulin responses to feed deprivation and feeding
Consistent with observations in other species, feed withholding or restriction in horses results in a number of changes in plasma metabolite and hormone concentrations that reflect a shift to catabolic metabolism, including reduced insulin concentrations (Sticker et al 1995, 1996; also see Chapter 29). Several studies in horses have reported serum or plasma insulin responses to feeding (for example, Vervuert et al 2009a, b, Borgia et al 2011). However, it must be emphasized that to date few (if any) of these studies have employed specific measures of insulin secretory response, making it difficult to determine the relative contribution of insulin secretion vs. tissue insulin sensitivity to the overall insulin response. In general, the pattern of insulin secretion will depend on the relative proportions of various nutrients, the physical form of the feed, and the effects of several factors that may influence nutrient absorption and the stimulation of insulin release (e.g. rate of gastric emptying, intestinal motility, release of incretin hormones and neural input). See Chapter 8 as well as a subsequent section in this chapter (Overview of Macronutrient Metabolism) for further discussion on glycemic and insulinemic responses to feeding.
Mechanisms of insulin action
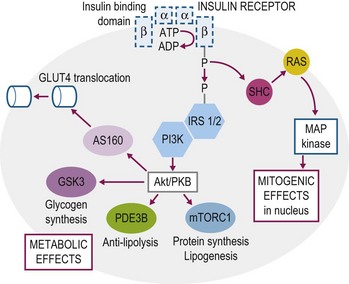
Insulin mediates its actions by binding to the insulin receptor, a heterotetramer with two extracellular alpha subunits that contain the ligand-binding domain and two transmembrane beta subunits that contain intrinsic tyrosine kinase activity. The insulin receptor has substantial structural homology with the insulin-like growth factor-1 receptor, which is also a member of the receptor tyrosine kinase super family (Nakae et al 2001). The binding of insulin to its receptor initiates a cascade of signaling events that result in mediation of insulin’s metabolic, vascular and mitogenic effects (Fig. 2.5, also see Storage of Energy Substrates in Skeletal Muscle and Adipose Tissue). These signaling events have been characterized primarily in rodent and human skeletal muscle with very little investigation in horse tissue. The insulin receptor has been detected in skeletal muscle as well as adipose and vascular tissues of the horse by use of Western immunoblot, PCR and immunohistochemical techniques (Annandale et al 2004, Asplin et al 2011, Burns et al 2011). In addition, at least three glucose transport proteins have been recognized in skeletal muscle and adipose tissue (GLUT1, GLUT4, GLUT12) and the effects of exercise and insulin stimulation on the phosphorylation of selected components of the insulin signaling cascade (e.g. Akt, glycogen synthase kinase-3, AS160) have been assessed in these tissues (McCutcheon et al 2006, Waller et al 2011a, b).
Key Points –
Insulin
• As an anabolic hormone, insulin stimulates the tissue uptake and storage of glucose, fatty acids and amino acids.
• As in other mammals, glucose is the primary stimulus for insulin secretion in the horse. The amino acids arginine and leucine also stimulate insulin secretion but, unlike ruminants, an increase in circulating volatile fatty acids does not elicit a major secretory response.
• The incretin effect, wherein an oral glucose load results in a greater insulin response compared to an isoglycemic IV glucose infusion, is mediated by the gastrointestinal peptides glucose-dependent insulinotropic polypeptide (GIP) and glucagon-like peptide-1 (GLP-1).
• Insulin secretory responses in horses are affected by age and physiologic state (including pregnancy and exercise).
Glucagon
Glucagon is a primary regulator of hepatic glucose production; in the liver a rise in circulating glucagon results in increased glycogenolysis and decreased glucose uptake, the net result being an increase in hepatic glucose output (Ramnanam et al 2011). Glucagon secretion is regulated by glucose – hypoglycemia and hyperglycemia increase and decrease, respectively, hormone release from pancreatic alpha-cells. The glucagon action to stimulate hepatic glucose output is a critical component of the counter-regulatory response to hypoglycemia. Glucagon also protects against a fall in blood glucose during exercise. The exercise-induced increase in the uptake of blood-borne glucose (primarily by contracting muscle) is accompanied by an increase in both hepatic glycogenolysis and gluconeogenesis, mediated in part by a rise in glucagon and a fall in circulating insulin (Wasserman et al 1989).
In comparison to insulin, there is little information on the dynamics of glucagon secretion and action in the horse, with the bulk of available data coming from studies in fetal and neonatal foals (see Fowden et al 2012). Glucagon concentrations in fetal foals increase during late gestation, reaching a peak at birth and then decline during a 10-day post natal period (Fowden et al 2012, Holdstock et al 2012). Moderate fluctuations in blood glucose concentration do not appear to influence circulating glucagon concentrations in neonatal foals. The IV administration of arginine induces an increase in plasma glucagon in fetal and neonatal foals, with higher secretory responses being reported in foals induced to deliver 24–48 h before term, compared to foals born spontaneously (Holdstock et al 2012). The glucagon response to arginine administration increases during the 10-day period postpartum. It has been suggested that glucagon functions as a stress hormone in the perinatal period, with a primary role in stimulation of gluconeogenesis (Fowden et al 2012).
An increase in circulating glucagon has been observed in horses during and after exercise, the magnitude of which is proportional to exercise intensity (Hall et al 1982, Geor et al 2000a, 2002). The induction of β-blockade (propranolol, 0.22 mg/kg BW IV) suppressed the exercise-associated rise in plasma glucagon concentrations in horses (Geor et al 2000a), suggesting the involvement of sympathetic mechanisms in glucagon secretion during exercise. Exercise training was associated with a decrease in the plasma glucagon response to exercise performed at the same absolute workload before and after 6 weeks of conditioning (Geor et al 2002).
Other pancreatic hormones
Several other pancreatic hormones may contribute to the regulation of energy metabolism, including pancreatic polypeptide and somatostatin. There are no published data on concentrations of somatostatin in horses. However, consistent with its well known effect on pancreatic function in other species, recent studies in the horse have demonstrated suppression of insulin secretion in response to the administration of synthetic somatostatin (Tóth et al 2010, Geor et al 2010).
Adrenal hormones
Catecholamines
The catecholamines play a major role in the regulation of cardiovascular function and carbohydrate/fat metabolism, especially during “flight and fright” responses (stressful stimuli) as well as during exercise. In these circumstances, there is local release of norepinephrine from sympathetic nerve endings and systemic release of epinephrine and norepinephrine from the adrenal medulla. There are two groups of catecholamine (adrenergic) receptors: α- and β-adrenergic receptors, which are further divided into α1-, α2-, β1- and β2-adrenergic receptors. In horses, most information on the dynamics of plasma catecholamines has come from exercise studies. At low-to-moderate intensity exercise (<50–60% of VO2max), there is minimal change in plasma catecholamine concentrations when compared to resting values. At higher exercise intensities, however, there is a curvilinear increase in catecholamines that is correlated with the change in plasma lactate concentrations (Gonzalez et al 1998; Nagata et al 1999).
Norepinephrine and epinephrine stimulate the mobilization of lipid and glucose stores. In adipose tissue, the catecholamines increase the activity of hormone sensitive lipase thereby stimulating lipolysis. Adrenergic control of lipolysis in adipocytes from subcutaneous adipose tissue of horses and ponies is dependent upon differential activation of β2-subtype (stimulatory) and α2-subtype (inhibitory) adrenergic receptors (Carrington et al 2003). In rats and ruminants, there is considerable variation in the lipolytic response to catecholamines between adipocytes from different fat depots (McNamara 1991, McNamara & Murray 2001); however, there have been no published equine studies on this aspect. Neither lipolytic responses to β-adrenergic agonists nor the expression of β2-adrenergic receptor mRNA was altered by early lactation in ponies (Carrington et al 2003), whereas lipolytic sensitivity is increased in the adipose tissue of cows during early lactation (McNamara 1991). The administration of the β-adrenergic antagonist propranolol (0.22 mg/kg BW IV) suppressed plasma non-esterified fatty acids (NEFA) concentrations at rest and during graded exercise in horses (Geor et al 2000a). Conversely, the administration of epinephrine resulted in a marked increase in plasma NEFA (Geor et al 2000b). Taken together, these data confirm the role of β-adrenergic mechanisms in lipolysis and systemic supply of NEFA in the horse (see Chapter 30 for further discussion on mechanisms controlling lipid mobilization).
Epinephrine participates in the regulation of glucose uptake into muscle as well as glycogenolysis in muscle, especially during exercise. Exogenous administration of epinephrine markedly decreases whole-body glucose disposal during exercise in man (Watts & Hargreaves 2002) and horses (Geor et al 2000b), suggesting that adrenergic stimulation impairs glucose uptake into muscle. Epinephrine also stimulates glycogenolysis in muscle (Geor et al 2000b) although studies in adrenalectomized human subjects have shown that glycogenolysis can occur in the absence of epinephrine (Kjaer et al 2000). In dog and man, epinephrine does not appear to mediate the increase in hepatic glucose production during low and moderate intensity exercise but may contribute during prolonged or heavy exercise when circulating epinephrine is very high (Wasserman 1995). The effect of epinephrine on hepatic glucose output in horses is not known.
Glucocorticoids
Cortisol is the major glucocorticoid secreted by the adrenal glands although smaller quantities of cortisone, corticosterone and deoxycorticosterone are produced. Cortisol secretion in horses shows a diurnal pattern with lowest values at night and highest values in the morning (6:00–10:00 a.m.; Thornton 1985). There is no published research on the effects of endogenous glucocorticoids on metabolism in horses; however, a number of studies have examined the effects of exogenous glucocorticoids (Freestone et al 1991, French et al 2000, Tiley et al 2007, Haffner et al 2009).
The glucocorticoids are catabolic hormones that stimulate substrate mobilization by enhancing gluconeogenesis, lipolysis and proteolysis. As one of the counter-regulatory hormones, cortisol acts to maintain plasma glucose concentrations by mobilizing substrates for hepatic gluconeogenesis (e.g., glycerol, amino acids) and by decreasing glucose utilization via antagonism of insulin-mediated glucose uptake (McMahon et al 1988). The parenteral administration of glucocorticoids to healthy horses induces moderate hyperglycemia (French et al 2000, Tiley et al 2007) as well as increases in plasma NEFA (French et al 2000) and serum triglyceride concentrations (French et al 2000). Hyperinsulinemia and decreased whole-body insulin sensitivity has been reported after single or repeated administration of glucocorticoids to horses (French et al 2000, Tiley et al 2007, Haffner et al 2009), although in one report the short-term administration of hydrocortisone apparently resulted in an increase in insulin sensitivity (de Graaf-Roelfsema et al 2005).
Somatotropic axis
The somatotropic axis, which consists of somatotropin (growth hormone, GH), insulin-like growth factors (IGF-I and -II) and their associated carrier proteins, plus GH and IGF receptors, plays a key role in the regulation of growth and metabolism. GH is synthesized in the anterior lobe of the pituitary, with its secretion under a dual control by two hypothalamic peptides – the GH releasing hormone (GHRH) which stimulates secretion, and somatostatin which is inhibitory. GH stimulates growth and development in young animals and, in animals of all ages, is regarded as the primary anabolic hormone during stress and fasting (Renaville et al 2002). GH exerts many of its somatotropic actions via IGF-I and IGF-II which are released from target tissues (e.g., liver) in response to GH (Renaville et al 2002). GH is one of the glucose counter-regulatory hormones (along with glucagon, epinephrine, and cortisol), reflecting its role in defending against hypoglycemia.
In general, nutritional status plays a major role in regulating the circulating concentrations of GH, IGF-I and binding proteins, as well as the number of cell membrane receptors. Elevated plasma GH concentrations are observed in growing cattle during prolonged fasting and in dairy cows during the first week of lactation, while GH concentrations are little changed in response to short-term (<24 h) feed restriction (Møller & Jørgensen 2009). In obese pony mares adapted to ad libitum feeding, 48-h of feed withholding resulted in increased pulse frequency, pulse amplitude and mean plasma concentrations of GH when compared to mares in the fed state (Buff et al 2007). Refeeding resulted in a rapid decrease in plasma GH concentrations. On the other hand, there was no effect of short-term (24 h) feed removal on GH in horses adapted to meal feeding (DePew et al 1994a, Sticker et al 1995), suggesting that feed deprivation exerts a stronger effect on GH secretion in horses and ponies that are fed ad libitum. A study of Welsh Mountain pony mares during winter and spring over 3 consecutive years examined the effects of longer term nutritional status on plasma GH and IGF-1 concentrations (Salazar-Ortiz et al 2011). Feed restriction (50% of energy requirements) or feeding management that mimicked the seasonal availability of pasture resulted in elevated GH when compared to the “well-fed” treatment, whereas plasma IGF-I was higher in the well-fed when compared to feed restricted groups. In this study, there was no correlation between plasma IGF-1 and GH concentrations but a significant correlation between IGF-1 and insulin was observed, raising the possibility that insulin stimulates IGF-1 secretion in the horse (Salazar-Ortiz et al 2011).
In other mammals, the most prominent metabolic effect of GH is a marked increase in lipolysis and fat oxidation (Renaville et al 2002). Thus, during prolonged feed withholding and other catabolic states, GH stimulates the release and oxidation of FFA which enables a reduction in glucose and amino acid oxidation and the preservation of glycogen reserves as well as lean body mass. The impact of GH on preservation of lean body mass in catabolic states is evidenced by the impact of GH deficiency during fasting, wherein amino acid oxidation, urea production rate, and muscle protein breakdown are all ~50% higher when compared to the values in non-GH deficient animals (Møller & Jørgensen 2009). GH antagonizes the hepatic and peripheral effects of insulin on glucose metabolism via mechanisms involving the concomitant increase in fatty acid flux and oxidation. Indeed, the anti-insulin effect of GH contributes to the relative insulin resistance that develops during fasting and inflammatory states. The administration of recombinant equine GH to healthy horses (20 µg/kg BW for 11 to 15 days) resulted in a significant 22% decrease in insulin sensitivity, as measured during a euglycemic–hyperinsulinemic clamp, when compared to horses treated with saline solution (de Graaf-Roelfsema et al 2005).
Key Points –
Glucose counter-regulatory hormones
• Glucagon, the catecholamines (norepinephrine, epinephrine), cortisol, and growth hormone are collectively termed glucose counter-regulatory hormones because they oppose insulin action on glucose metabolism. In the face of hypoglycemia, these hormones stimulate hepatic glucose output and decrease glucose uptake into peripheral tissues.
• The catecholamines and, to a lesser extent, cortisol and growth hormone, also stimulate the mobilization and utilization of fatty acids.
• The action of growth hormone on lipid metabolism is critical to the preservation of lean body mass during prolonged feed withholding and other catabolic states.
Thyroid hormones
Thyroid hormone secretion is stimulated by thyroid-stimulating hormone (TSH) from the anterior pituitary gland, which itself is regulated by hypothalamic thyrotropin-releasing hormone (TRH). TSH exerts trophic effects on the thyroid glands including stimulation of follicular cell growth and activity, iodide uptake, and the synthesis of triiodothyronine (T3) and thyroxine (T4). The thyroid gland releases a much greater quantity of T4 than T3, and the majority of T3 is derived from deiodination of T4 in the peripheral tissues by type 1 and type 2 deiodinases, which are selenoproteins (Brehaus 2011). Therefore, T4 is the major precursor for T3 which is the more metabolically active of the two hormones. Major actions of the thyroid hormones include the stimulation of basal metabolic rate (oxygen consumption) and heat production, ionotropic and chronotropic effects in the heart, regulation of the expression of β-adrenergic receptors in multiple tissues, and fetal growth (especially brain development and skeletal maturation). The effects of the thyroid hormones on oxygen consumption and heat production are due in part to stimulation of Na+-K+-ATPase in most tissues.
Hypothyroidism is apparently rare in horses and few clinical abnormalities have been detected in mature horses subjected to bilateral thyroidectomy (Lowe et al 1974, Frank et al 2003, 2004). Plasma triglycerides, very low-density lipoproteins and low-density lipoproteins were higher in horses following thyroidectomy (Frank et al 1999) but adaptations to a higher fat diet (7.3% crude fat), including increases in post-heparin lipoprotein lipase and hepatic lipase activities, were not affected by thyroidectomy (Frank et al 2004). Decreased resting heart rate, cardiac output, respiratory rate and rectal temperature have also been observed after thyroidectomy, likely reflecting the effect of thyroid hormone deficiency on metabolic rate and β-adrenergic receptor expression (Vischer et al 1999). In young growing horses, however, thyroidectomy resulted in several abnormalities including decreased growth rate, delayed physeal closure, coarse hair coat, and lethargy (Lowe et al 1974). The thyroid hormones are essential for normal organ development and growth and it is therefore not surprising that deficiency results in more obvious clinical problems in foals when compared to mature horses.
Serum thyroid hormone concentrations are two- to threefold higher in neonatal foals when compared to the values in mature animals; concentrations gradually decrease to adult levels over the first 2–3 months of life (Irvine et al 1975, Chen & Riley 1981). Nutritional status, exercise and possibly season also influence serum thyroid hormone concentrations in horses but there is little information regarding mechanisms underlying these variations. Increases in serum T3 and T4 are observed with meal feeding in horses (Sticker et al 1996, Powell et al 2000). These responses are blunted in horses fed an energy-restricted diet (Powell et al 2000). However, neither short-term (45 h) feed deprivation (Sticker et al 1995a) nor the feeding of energy or protein restricted diets (50–70% of requirements; Sticker et al 1996, Powell et al 2000) altered basal serum T4 and T3 concentrations. In contrast, a rapid decrease in circulating thyroid hormone concentrations has been reported with dietary restriction in rats (Schalch & Cree 1985) and cattle (Blum et al 1985).
In weanling horses, the ingestion of a diet providing 130% of energy and protein requirements was associated with a more rapid and higher magnitude increase in serum T3 when compared to a diet providing 100% of requirements. Serum T4 concentrations decreased in response to feeding, and it was suggested that the meal-associated rise in insulin concentration accelerated the conversion of T4 to T3 (Glade & Reimers 1985). In a subsequent study, the intragastric administration of sucrose but not casein to weanling horses resulted in an increase in serum T3 and T4 concentrations, suggesting that the digestion of soluble carbohydrate (sucrose) but not protein triggers thyroid hormone responses in horses (Glade & Luba, 1987). These authors hypothesized that pronounced thyroid hormone responses to the feeding of high-starch or high-sugar diets to growing horses may increase risk of osteochondrosis and other development orthopedic disorders. However, subsequent studies have not found a link between diet composition, thyroid hormones and incidence of orthopedic problems in growing horses (e.g., Ott et al 2005). Also see Chapter 32.
In Quarter Horse mares maintained under constant energy balance, TSH secretion was greater in summer compared to winter, whereas mean T4 concentrations were slightly greater in winter than in summer (Buff et al 2007). In contrast, seasonal variation in serum T4 concentrations was not apparent in a small group of mixed-breed horses maintained under similar management conditions over a 1-year period (Place et al 2010).
In general, serum T3 and T4 increase in proportion to the intensity and duration of exercise in horses (Gonzalez et al 1998). In endurance horses, no change or only a transient decrease in plasma free T4, free T3, T3 and T4 was observed after rides between 40 and 56 km, whereas a more marked decrease was reported with longer rides (160 km; Graves et al 2006).
Overview of macronutrient metabolism
Glucose and insulin responses
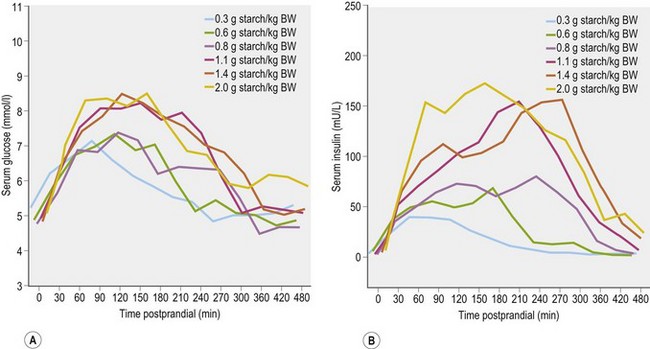
When horses ingest meals containing starch and/or sugar (e.g., cereal grains or a sweet feed that contains grains and molasses), there are post-feeding increases in blood glucose and insulin concentrations. The magnitude of the glycemic and insulinemic responses will depend on several factors, including size of meal, starch and sugar content, pre-cecal starch digestibility, and the rate of ingestion (Harris & Geor 2009). When starch of high prececal digestibility was provided in a compound feed, at levels between 0.3 g and 2.0 g starch/kg BW, serum glucose concentrations increased to reach a peak between 90 and 120 min post-feeding with a return to baseline concentrations by 4–7 hours. Serum insulin concentrations increased to reach a peak between 90 and 180 min post-feeding and similarly returned to baseline values by 4–7 hours (Vervuert et al 2009a; Fig. 2.6). In general, the magnitude of these responses increased as a function of starch dose but the relationship was not linear. The authors of this study recommended that starch intake be limited to no more than 1.1 g/kg BW (meal size 0.3 kg/100 kg BW when compound feeds and cereals contains 30–40% starch are fed) based on the moderate glycemic (increase from ~5 mmol/l to ~7 mmol/l) and insulinemic (from ~5 to ~50 µU/ml) responses observed at starch intakes below this threshold (Vervuert et al 2009a).
Glycemic and insulinemic responses are much smaller when horses consume roughage (e.g., preserved forage) when compared to grain-based feeds, although moderate increases in serum insulin concentrations have been observed after ingestion of hay with relatively high non-structural carbohydrate (NSC) content (Borgia et al 2011). In horses fed “high” NSC (17.1% DM) Italian rye (Lolium multiforum) hay at 0.5% BW, serum insulin concentration increased from a mean of ~4 µU/ml to a peak of ~50 µU/ml between 60 and 120 min post-feeding, whereas there were minimal changes in serum insulin after ingestion of the same quantity of medium (10.6% NSC) and low (4.4% NSC) NSC content hay (Borgia et al 2011; Fig. 2.7). The results of this study lend support to the recommendation that laminitis-prone horses or ponies be fed hay with NSC content <10–12% to avoid post-feeding increases in circulating insulin concentrations that may increase risk of laminitis episodes. Interestingly, the addition of purified soluble (pectin) or insoluble (lignocelluloses) fiber to a meal of cracked corn did not affect postprandial glucose and insulin responses when compared to a meal of cracked corn alone (each treatment provided a starch intake of 2 g/kg BW; Vervuert et al 2009b). Similarly, the addition of alfalfa (crude fiber intake of 0.5 g/kg BW) before, mixed with, or after a meal of oats (2 g starch/kg BW) did not significantly alter glycemic and insulinemic responses; in this study, breath hydrogen production was lower when alfalfa was fed before or with the oats, perhaps reflecting improved starch hydrolysis in the small intestine along with reduced bacterial fermentation (Vervuert et al 2009c). As well, the addition of short-chop (<2 cm in length) alfalfa (Lucerne) chaff to a sweet meal did not alter glycemic response (Harris et al 2005). These findings contrasted with the results of earlier studies that demonstrated decreased glycemic responses when long fiber hay was fed before or mixed with a starch-based meal (Radicke et al 1994, Pagan & Harris 1999).
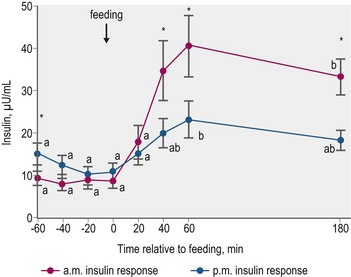
Glycemic and insulinemic responses to feeding may be modulated by the effects of meals consumed in the prior few hours. Gordon and McKeever (2005) fed Standardbred mares identical grain-based meals at 0730 and 1530 h, and observed significantly smaller increases in plasma insulin concentrations in response to the afternoon feeding (Fig. 2.8). This “second meal effect”, characterized by enhanced glucose tolerance when successive glucose loads are ingested within a relatively short time span, is well described in humans (Wolever et al 1988). The colonic fermentation of indigestible carbohydrates in the first meal is thought to contribute to the second-meal effect in humans via a reduction in circulating NEFA that enhances glucose disposal (Brighenti et al 2006). The differential response between morning and afternoon meals, as reported by Gordon and McKeever (2005), may be in part due to the inhibitory effect of higher morning cortisol concentrations on insulin-mediated glucose utilization.
There is no information in horses on the disposition of the glucose load absorbed as a result of the pre-cecal digestion of starches and simple sugars. In humans and dogs, between one-quarter and one-third of an oral glucose load is taken up by the splanchnic tissues and liver, with about 10% of the glucose load extracted by the liver on first pass and the remainder removed from circulation on subsequent passes (Dardevet et al 2002a). The liver takes up two to three times as much glucose following oral glucose ingestion as compared to uptake under similar hyperglycemic and hyperinsulinemic conditions induced by intravenous glucose infusion (Moore et al 2003). Approximately 35–45% of an oral glucose load is taken up by insulin-sensitive tissues (skeletal muscle and adipose tissue) and the remaining 25–30% is utilized by non-insulin-dependent tissues (e.g., red blood cells, central nervous system; Meyer et al 2002, Moore et al 2003; Dardevet et al 2002a). A similar partitioning of glucose disposal occurs after ingestion of a mixed meal in humans (Woerle et al 2003) but as noted above there is no information in the horse. The mechanisms of glucose utilization in insulin-sensitive tissues are discussed below (see Storage of energy substrates in skeletal muscle and adipose tissue).
Key Points –
Glucose and insulin responses to meal feeding
• Several factors affect the magnitude of glycemic and insulinemic responses to meal feeding, including meal size, starch and simple sugar content, the prececal digestibility of the starch, and the rate of feed intake.
• The addition of soluble or insoluble fibers to a grain-based meal or the mixing of moderate quantities of short chopped roughage (e.g., chaff) does not substantially alter postprandial glycemic and insulinemic responses.
• Glycemic and insulinemic responses to grain-based meals are lower in the afternoon when compared to the morning. Diurnal variation in cortisol concentrations may contribute to this differential response.
Amino acid and protein metabolism
Basal (i.e., in the postabsorptive state in meal fed horses) plasma amino acid concentrations change little from day to day in mature horses at maintenance and do not show diurnal variation (Johnson & Hart 1974, Hackl et al 2006). Plasma concentrations also are fairly stable during short-term (≤24 h) feed withholding but increase during longer periods of fasting, likely reflecting catabolism of tissue proteins with utilization of amino acids for ATP synthesis or gluconeogenesis (Johnson & Hart, 1974, Russell et al 1986). Plasma concentrations of free amino acids increase following meal ingestion in horses (Johnson and Hart 1974, Russell et al 1986, Urschel et al 2011). The extent of these increases is dependent on the size and composition of the feed; in general peak concentrations occur 2–5 h post-feeding and then decrease toward basal values over a 4–8 h period (Russell et al 1986). In man and dog, it is well established that the splanchnic tissues extract a substantial proportion of the dietary amino acid load (Ferrannini et al 1988), with 20 to 96% of enterally administered amino acids utilized by the splanchnic bed (Mathews et al 1993). Several of the nonessential (dispensable) amino acids (e.g., glutamate and aspartate) are extensively oxidized by enterocytes of the small intestine with minimal entry of these amino acids into the portal circulation (Wu 2009). In addition, 30–50% of the essential (indispensable) amino acids may be subjected to first pass splanchnic extraction and metabolism (including urea synthesis) within enterocytes (Wu 2009). As a consequence, the nature and extent of postprandial increases in peripheral blood amino acid concentrations will not mirror the amino acid composition of the ingested feed.
After ingestion of low-protein pelleted feed (crude protein 8.1% DM; size of meal not provided) in mixed-breed geldings, concentrations of essential amino acids increased to 132% of basal values at 2 h post-feeding while nonessential amino acids increased to a lesser extent but remained elevated for a longer duration (Johnson & Hart 1974). In contrast, the ingestion of a high-protein feed (33.2% CP; lysine 1.63%; leucine 2.11% DM basis) at ~3.8 g/kg BW (as-fed basis) elicited a more substantial rise in the plasma concentrations of essential and non-essential amino acids; for example, plasma lysine increased from a mean baseline value of 124 µmol/l to 282 µmol/l at 80 min post-feeding while plasma leucine increased from 123 µmol/l to a peak of 188 µmol/l at 40 min post-feeding (Urschel et al 2011
Stay updated, free articles. Join our Telegram channel

Full access? Get Clinical Tree


