Fig. 3.1
Two images from the same eye of a patient with asteroid hyalosis. The highly reflective calcium deposits in the vitreous obscure retinal details (left frame). However, with fluorescein angiography (right frame), the light source (i.e., fluorescing green light) is the retina itself. So, reflections are avoided and more retinal details are apparent
3.2.11 Correlation with SD-OCT and Functional (Electrophysiologic) Findings
Using a combination of testing modalities can help the investigators detect and localize potential drug-related toxic effects early on in preclinical studies. An example of this from clinical medicine is looking for convergence of various testing modalities. In other words, if physicians have a human patient with a puzzling retinal condition, they often employ a combination of anatomic and functional measures which hopefully point to a single diagnosis. Some of these are recently developed and often expensive tests, but fundus photography is nearly always included. A case in point is hydroxychloroquine (Plaquenil®) toxicity. Hydroxychloroquine is used to treat rheumatologic conditions such as rheumatoid arthritis and systemic lupus erythematosus. In patients who are on the drug for many years, retinal (macular) toxicity can develop, which is unfortunately irreversible. Therefore, it is critical to make the diagnosis of toxicity as early as possible. In addition to visual field testing, electrophysiology, and SD-OCT, we also rely on fundus photography to monitor for subtle changes in macular pigmentation.
3.3 Corneal Confocal Microscopy
3.3.1 Basic Principles
Unlike conventional light microscopes, the confocal microscope overcomes the problem of defocused light by using the confocal principle [2]. Light from a pinhole light source is focused by an objective lens onto a tissue specimen. The reflected light is collected by a parallel objective lens and focused onto a second pinhole aperture where it is collected by a detector. Light reflected by the specimen focal point is “co-focused” with the detection aperture and said to be confocal, meaning that the illumination and detection paths share the same focal plane. Light reflected from tissue slightly in front of or behind the specimen focal point is “defocused” and undetected (Fig. 3.2). The confocal design provides high-resolution and superior image contrast (Fig. 3.3). See Guthoff et al. [3], for a review of human clinical applications [3].
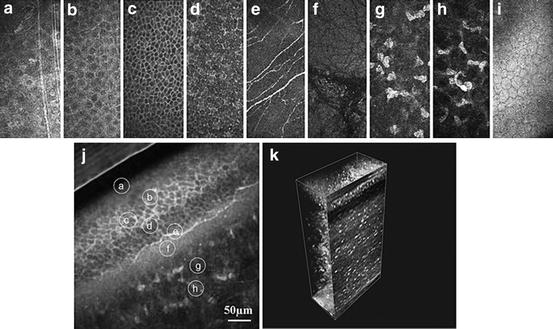
Fig. 3.2
Schematic principle of the confocal arrangement implemented in the HRT-II + RCM system for in vivo confocal microscopy of the cornea. HRT, Heidelberg Retina Tomograph; RCM, Rostock Cornea Module (Guthoff et al. [3]; used with permission)
Fig. 3.3
In vivo confocal images of the normal cornea. (a) Superficial cells. (b) Upper wing cells. (c) Low wing cells. (d) Basal cells. (e) Subbasal nerve plexus. (f) Bowman’s membrane. (g) Anterior stroma. (h) Posterior stroma. (i) Endothelium. (j) Oblique section through corneal epithelium and anterior stroma – all layers are present. (k) Three-dimensional (3D) reconstruction of the whole cornea (Guthoff et al. [3]; used with permission)
3.3.2 Performance Parameters
Corneal confocal microscopy is a useful tool for studying the anatomy of the eye and particularly the cornea [4–9] such as measuring corneal thickness in vivo [10, 11] and corneal edema [12].
Based on the morphologic appearance of keratic precipitates, in vivo corneal confocal microscopy may aid in the diagnosis of extramammary Paget’s disease [13] and uveitic syndromes including Behçet’s disease [14], and it can be used as an aid in differentiating infectious from noninfectious uveitis [15]. It has been used to describe the corneal changes associated with mesodermal dysmorphodystrophy (Weill–Marchesani Syndrome) [16] and dry eyes [17]. In vivo corneal confocal microscopy can provide high-quality imaging that can be used to identify the pathological characteristics of traumatic ocular events, such as recurrent corneal erosion [18], and describe age-related corneal changes [19] and the appearance of disorders affecting the cornea such as iridocorneal endothelial syndrome [20] and polymorphous dystrophy [21].
Corneal confocal microscopy is increasingly being used for assessing the subbasal corneal nerve plexus in a variety of different pathological conditions including the effects of long-term contact lens wear, keratoconus [22], dry eye syndrome, neurotrophic keratopathy and infectious keratitis, corneal refractive surgery, corneal transplantation [23, 24], and systemic illnesses, such as diabetes mellitus [25, 26], Fuchs heterochromic cyclitis [27], rheumatoid arthritis [28] and nephropathic cystinosis [29]. Laser-scanning corneal confocal microscopy has also been used ex vivo to examine postmortem changes of the central and peripheral human corneal nerves [30].
The transplantation of amniotic membrane to the surface of the eye has been used to promote epithelialization in patients with ocular injuries such as chemical burns and corneal ulcers. Corneal confocal microscopy enables visualization of the corneal epithelium despite the presence of the amniotic membrane [31].
3.3.3 Use in Animal Toxicology and Other Ocular Research
As is the case with most medical instruments, corneal confocal microscopy was primarily developed for and has its most common use in the diagnosis and monitoring of human disease. However, just like the other imaging and analytic techniques discussed in this chapter, corneal confocal microscopy has proven to be useful in animal toxicologic as well as basic research studies. For example, it has been used in several veterinary and toxicologic applications including corneal examination of horses, dogs, cats, and birds [32–35]. A murine model of endotoxin-induced uveitis has been used to study the changes in corneal endothelium to better understand the mechanism of keratic precipitate formation [36]. In vivo corneal confocal microscopy was performed after lipopolysaccharide injection in rats. Corneal confocal microscopy images were compared with ex vivo corneal endothelium immunostaining and showed numerous round hyperreflective dots on the corneal endothelium, anterior chamber, and anterior stroma. Based on this animal study, in vivo corneal confocal may be useful clinically for analyzing keratic precipitates and other corneal changes in patients with uveitis.
The rabbit cornea is well suited to toxicologic, surgical, and device (e.g., contact lens) studies because its size is close to that of the human cornea [37, 38]. Some of the many toxicologic studies using corneal confocal microscopy in rabbit are listed in the reference section [39–45]. Good correlation has been found in rabbit between in vivo imaging with the corneal confocal microscope and in vitro histologic findings [46]. Wound healing [47, 48] and device [49] studies in rabbit have also made use of the corneal confocal microscope.
Other animal models have also been employed. A study of corneal cosmetic pigmentation in chickens (with potential applications for blind, unsightly human eyes, such as occurs after severe trauma) used corneal confocal microscopy to localize the pigment and assess the surrounding cornea for signs of degeneration and inflammation [50]. In a nonhuman primate study, the safety and efficacy of a topical antibiotic (levofloxacin) following penetrating keratoplasty was monitored with the corneal confocal microscope, and it was determined that the keratocyte structure and stromal organization remained intact [51].
3.3.4 Human Clinical Applications
In the clinic, one of the most important applications for corneal confocal microscopy is to help in the diagnosis of certain infectious processes. Bacteria are too small to be readily identified by in vivo microscopy. Fortunately, most bacteria that affect human ocular health can be quickly and inexpensively identified by standard culture methods. More problematic are amoebic and fungal keratitis, both of which are chronic conditions that can masquerade as other pathologies. Furthermore, amoebae and fungi are difficult to culture, often requiring weeks before a definitive diagnosis can be made. Culturing the cornea is an invasive procedure, and the results can vary depending on the skill of the surgeon; however, characteristic morphologic features of amoebae (Fig. 3.4) [52–54] as well as fungal hyphae [55, 56] can be quickly identified with corneal confocal microscopy. The results are immediate, and the sensitivity and specificity profiles are comparable to those of traditional microbiologic culturing [57].
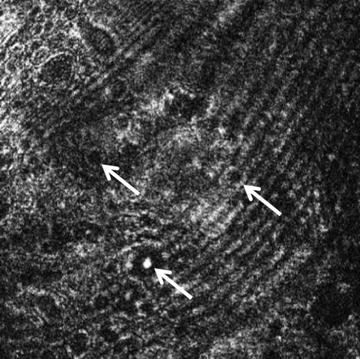
Fig. 3.4
Corneal confocal microscopic image taken with the HRT Rostock Cornea Module (Heidelberg Engineering) of a human corneal ulcer caused by Acanthamoeba. Double-walled trophozoites are apparent (upper arrows) as is a highly reflective cyst (lower arrow). The cysts can be up to 20 μm in diameter (Courtesy of Sarah M. Nehls, MD, University of Wisconsin School of Medicine and Public Health)
Corneal confocal microscopy was used to determine if patients with dry eye experience changes in corneal nerves and corneal sensation [58]. The epithelium, stroma, and subbasal corneal nerves were evaluated with a corneal confocal microscope. Mechanical, chemical, and thermal sensations were evaluated using a noncontact esthesiometer. A significant decrease in the number and density of subbasal nerves and the density of superficial epithelial cells was observed in patients with dry eyes. The number and density of subbasal nerves was higher in younger patients. A significant decrease was found with respect to mechanical, chemical, and thermal sensitivity which was strongly correlated with the density of subbasal nerves.
Corneal confocal microscopy was also used to investigate the ocular toxicity of an oral antineoplastic drug containing a 5-fluorouracil prodrug by evaluating treated patients using laser-scanning corneal confocal microscopy [59]. Slit-lamp examination revealed epithelial invasion toward the center of the cornea in all examined eyes. In vivo corneal confocal microscopy revealed changes the corneal epithelium structure with abnormal epithelial cells and inflammation. Cytologic diagnosis showed moderate dysplasia in one specimen. Hematoxylin and eosin staining revealed that abnormal corneal epithelial sheets lacked the stratified structure of normal epithelium. It was concluded that the oral antineoplastic drug can induce ocular mucositis with dysplasia of the corneal epithelium.
In vivo corneal confocal microscopy has been used to describe the clinical effects of human herpes simplex virus keratitis [60]. Endothelial alterations characteristic of endotheliitis were observed including pseudoguttata, enlarged intercellular gaps, infiltration of inflammatory cells into the endothelial layer, loss of defined cell boundaries, spotlike holes, and endothelial denudation. Although endotheliitis-specific alterations appear to resolve, the corneal endothelium remained irreversibly damaged in some patients.
In patients with nephropathic cystinosis, corneal confocal microscopy has been used to describe the presence of randomly oriented spindle, needle-shaped, and fusiform hyperreflective crystals in all corneal layers except the endothelium with the greatest density observed in the anterior stroma [29]. When used to assess the conjunctival epithelial characteristics in untreated ocular hypertension and in topically treated primary open-angle glaucoma, corneal confocal microscopy revealed the presence of conjunctival microcysts in all hypertensive and glaucomatous eyes [61]. The conjunctiva may therefore be useful for noninvasive assessments of glaucoma pathology.
In one study, in vivo corneal confocal microscopy was used to correlate corneal microstructure and recovery of the subbasal nerve plexus following cornea transplantation [62]. Corneas from 42 patients undergoing penetrating keratoplasty were assessed with laser scanning in vivo corneal confocal microscopy and compared with 30 normal controls. After an average of 85 months, significant observations included reductions in epithelial, keratocyte, and endothelial cell densities. There were also significant reductions in sub-basal nerve fiber density and nerve branching. Endothelial cell density decreased with increasing time after surgery, while nerve fiber density increased. Corneal transplantation for keratoconus was associated with higher sub-basal nerve fiber densities than other indications. Neither nerve fiber nor cell density was correlated with improved visual acuity. In vivo corneal confocal microscopy revealed substantial reductions in cell density at every level of the transplanted cornea.
3.3.5 Commercially Available Devices
Available units:
HRT Rostock Cornea Module (Heidelberg Engineering, Heidelberg, Germany)
Confoscan 4 (Nidek Technologies, Padova, Italy)
3.3.6 Considerations for Ocular Toxicology Studies
As a noninvasive way of determining corneal architecture at the cellular level, corneal confocal microscopy is ideally suited to long-term toxicologic studies. Being able to assess corneal health in vivo rather than having to rely only on postmortem histopathology can greatly reduce the total number of animals needed since numerous time points can be monitored in each animal.
The Rostock Cornea Module is an add-on to the Heidelberg Retinal Tomograph (HRT). As such, it may be more economical to consider the combination as opposed to separate confocal and scanning laser units.
3.3.7 Limitations and Caveats
Even though it is possible to image corneal endothelial cells with the corneal confocal microscope, a dedicated specular microscope with associated image analysis software will image and analyze a wider field with greater numbers of cells [63].
3.4 Specular Photomicroscopy
3.4.1 Basic Principles
Clinical specular microscopes provide a high magnification view of specular reflected light from the corneal endothelium. The specular reflex occurs at the interface of two materials with sufficiently different refractive indices. For example, endothelial cells can be imaged because their refractive index is greater than the adjacent aqueous humor, resulting in reflected light (Fig. 3.5). For a comprehensive review, see McCarey et al. [64].
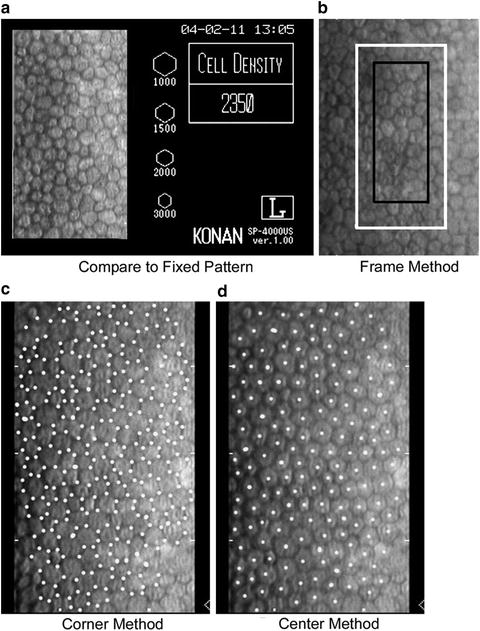
Fig. 3.5
There are four techniques to analyze endothelial cell images: (a) Compare relative cell size to standards, (b) count cells within a predetermined fixed frame with the frame size significantly affecting accuracy, (c) an algorithm using inputted cell corners, and (d) an algorithm using inputted cell centers (McCarey et al. [64]; used with permission)
This imaging technique has been shown to produce highly consistent results [65, 66]. Imaging of the endothelial cells with subsequent analysis of their density and morphology is considered an important endpoint in studies involving therapeutic agents or devices applied to the ocular surface that could impact endothelial function and survival as well as safety assessment of devices implanted into the anterior segment of the eye. Specular imaging is complimentary with the performance of corneal pachymetry (measurement of corneal thickness) that provides an indication of overall corneal endothelial cell health as reflected by their ability to maintain the relatively dehydrated state of the corneal stroma through their pumping action.
3.4.2 Performance Parameters
Specular microscopy is used for in vivo imaging and assessing the morphology of the corneal endothelium [67, 68] and central corneal thickness in patients with glaucoma [69] and keratoconus [70] and also following endothelial keratoplasty [71, 72]. Other applications include detecting corneal ectasia following laser in situ keratomileusis [73–75], determining central corneal endothelial cell density [76, 77] and endothelial vacuole formation in donor corneas [78].
3.4.3 Use in Animal Toxicology and Other Ocular Research
A sustained increase in intraocular pressure is known to result in the loss of corneal endothelial cells and cause increased corneal thickness. These effects have been documented in monkeys which are commonly used as a model of human glaucoma [79]. One study examined male rhesus monkeys with chronic argon laser-induced ocular hypertension in one eye. Using a noncontact specular microscope, mean central corneal thickness in the hypertensive and normal eyes were similar. A significant loss of endothelial cells was observed in the center of the cornea of laser-treated eyes. Endothelial cell density was inversely related to the duration of intraocular pressure elevation.
Other studies using specular microscopy have established the similarity of the normal canine corneal endothelium and that of humans [80, 81]. In one study, spectral microscopy was used to determine the density and morphology of endothelial cells in cynomolgus monkey, dog, and rabbit [82]. All three species in this study had similar endothelial cell morphologies and densities (Figs. 3.6 and 3.7). Furthermore, the endothelial cell densities, as determined by a noncontact spectral microscope, were in statistical agreement with a contact spectral microscope in the rabbit. The endothelial cell densities in rabbit were also similar to that found by ex vivo analysis of the corneas stained with alizarin red.
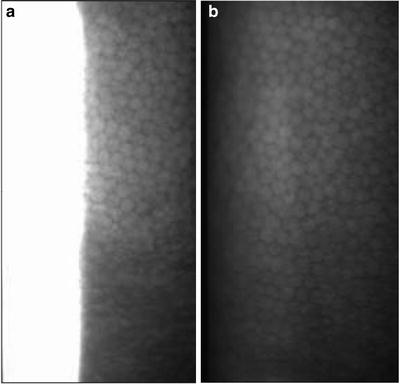
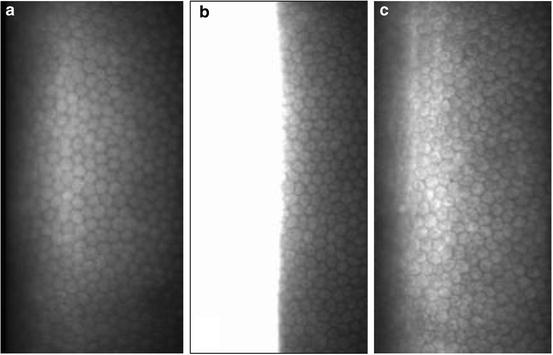
Fig. 3.6
Representative noncontact specular microscopic images of cynomolgus monkey endothelium without (a) and with (b) a plano contact lens on the cornea. Note the use of a plano contact lens on the cynomolgus monkey cornea provides a full-screen image (Miller et al. [82]; used with permission)
Fig. 3.7
Representative noncontact spectral microscopic images of monkey (with plano contact lens) (a), rabbit (b), and dog (c) endothelium. The morphology and density of the endothelial cells are similar amongst the three species (Miller et al. [82]; used with permission)
3.4.4 Human Clinical Applications
3.4.5 Commercially Available Devices
3.4.5.1 Contact Specular Microscopes
Available units:
Tomey EM-3000™, Tomey USA, Phoenix, AZ
HAI CL-1000xyz ™, HAI Labs, Lexington, AZ
3.4.5.2 Noncontact Specular Microscopes
Available units:
CellCheck XL™, Konan Medical USA, Inc., Irvine, CA
HAI CL-1000nc™, HAI Labs, Lexington, AZ
3.4.6 Considerations for Ocular Toxicology Studies
Contact as well as noncontact specular microscopes are available. The contact instruments require topical anesthetic in conscious human patients and are more uncomfortable than noncontact testing. They have the advantage that they flatten the cornea somewhat, which permits a greater field of view that is possible with the noncontact instruments. In the hands of an unskilled operator, corneal abrasion caused by the contact lens is a possibility.
Consistent data can be generated with either contact or noncontact devices; however, there is poor agreement between the two. Thus, the instruments cannot be used interchangeably [84].
Operator experience is critical in obtaining reliable data. Well-defined criteria need to be established for training purposes in acquiring and analyzing images [64].
3.4.7 Limitations and Caveats
Both specular and corneal confocal microscopy are capable of measuring corneal thickness as well as endothelial cell morphology and density; however, each instrument has its own advantages and limitations. The corneal confocal microscope can look at all layers of the cornea and is especially good for certain types of infectious and toxicologic pathologies (see Sect. 3.3); however, specular microscopy has the advantage that it looks at a larger number of endothelial cells. Salvetat et al. [63] found that the confocal microscope (HRT Rostock Cornea Module™, Heidelberg Engineering) significantly underestimated the endothelial cell density in eyes with reduced cell density and overestimated the endothelial cell density in eyes with high cell density compared to the Tomey EM-3000™ (Tomey, USA).
3.5 Scheimpflug Imaging
3.5.1 Basic Principles
Scheimpflug imaging is based on the Scheimpflug principle which describes the orientation of a camera focus plane when the plane of the lens and the plane of the image are not parallel. Using a slit illumination system, a thin layer of the eye is illuminated. This sectional image is photographed from the side view by a rotating Scheimpflug camera. By repeating the process, a series of radially oriented images of the anterior eye chamber can be generated. Analysis of the sectional images can detect tissue boundaries and layers such as anterior and posterior corneal surfaces, iris, and crystalline lens. The stored sectional images can be used to create a 3-dimensional model of the entire anterior eye chamber (Figs. 3.8 and 3.9). For reviews, see Wegener et al. (2009), and Rosales et al. (2009) [85, 86].
Fig. 3.9
Schematic illustration of the sequential ray tracing through the nodal point of the camera lens performed to correct the optical distortion caused by the ocular components (posterior cornea by the anterior cornea, anterior lens by the anterior and posterior cornea, and posterior lens by anterior and posterior cornea and anterior lens) (Rosales et al. [85]; used with permission) [86]
3.5.2 Performance Parameters
The Scheimpflug imaging system can be used to measure the shape of the cornea [87] and for objectively assessing lens and cataract changes when used together with lens densitometry [88]. Following cataract surgery, Scheimpflug tomograms are used to measure intraocular lens tilt and decentration [89] and quantify posterior capsule [90]. Scheimpflug imaging can also measure intraocular lens central optic thickness to determine intraocular lens power [91].
Measuring posterior corneal elevation using the Scheimpflug system is an effective means for distinguishing keratoconus from normal corneas but is less effective for identifying subclinical keratoconus [92]. Scheimpflug imaging has been used to diagnose anterior lenticonus [93], a rare congenital condition which causes part of the crystalline lens capsule and underlying cortex to bulge anteriorly resulting in severe myopia and lenticular irregular astigmatism.
Scheimpflug imaging is also a means for precise localization of retained intraocular foreign bodies [94]. As such, it may prove to be useful in toxicity and efficacy animal studies utilizing intravitreal sustained-release drug implants.
3.5.3 Use in Animal Toxicology and Other Ocular Research
Scheimpflug imaging and the associated quantitative densitometry are valuable adjuncts for assessing the cornea and lens in toxicology studies. For example, in animal toxicity models, lens changes including subclinical ones have been detected and the change in density of light scattering measured (Fig. 3.10) [95–98]. Other ocular research includes detailed studies of the accommodative mechanisms of the lens and ciliary muscle in rhesus monkeys in order to better understand presbyopia, or loss of near vision with aging in humans (Fig. 3.11) [99–101] (see also Sect. 3.6). As part of the studies on accommodation, Scheimpflug videography has also been developed as a research tool [102].
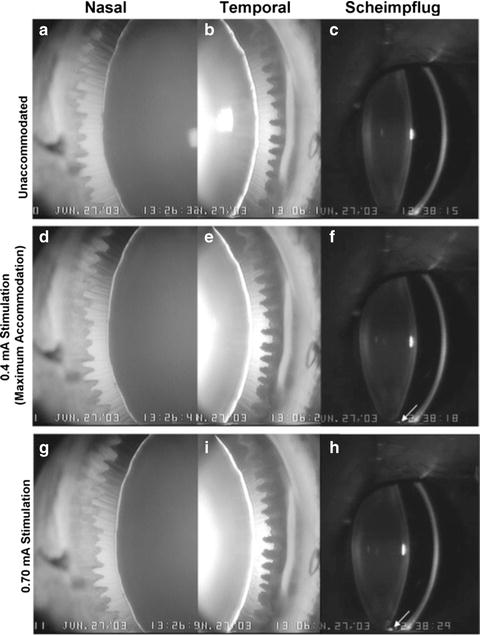
Fig. 3.10
Series of Scheimpflug images from a rat lens documenting the development of a diabetic cataract. The densitograms on the right show growth of the lens peak (second from the right) over time (Wegener et al. [86]; used with permission)
Fig. 3.11
Goniovideography images showing the nasal and temporal quadrants of a 14-year-old rhesus monkey eye in the nonaccommodated state (a, b) and during maximal (d, e) and 0.70-mA (g, i) stimulation. The numbers represent the stimulus current in milliamperes (mA). The zonular fibers appeared taut when the eye was nonaccommodated (a, b). The lens did not move downward pronouncedly within the eye during accommodation. The circumlental space in both quadrants in the nonaccommodated state was similar superiorly and inferiorly and remained fairly uniform during maximum accommodation. During supramaximal stimulation, the zonular fibers in the accommodated state were more relaxed inferiorly than superiorly but were not oriented predominantly in a downward direction, as in Figure 2 F (Movie 1, http://www.iovs.org/cgi/content/full/47/3/1087/DC1). Scheimpflug images show the anterior segment in the nonaccommodated (c) state and during maximal (f) and 0.70-mA (h) stimulation. The inferior ciliary processes (arrow) came into view during maximal stimulation (f) and touched the inferior lens during the 0.70-mA stimulation (h) (Croft et al. [99]; used with permission)
3.5.4 Human Clinical Applications
Scheimpflug imaging can aid in the diagnosis of subclinical and clinical keratoconus, a degenerative corneal disease characterized by stromal thinning and conical ectasia [103]. Higher levels of vertical coma, primary coma, and coma-like aberrations are present in keratoconic eyes compared to normal eyes [104]. Corneal collagen cross-linking with riboflavin and ultraviolet-A light has been proposed as a treatment for progressive keratoconus. Following treatment, assessment of corneal curvature, elevation, and thickness using Scheimpflug imaging showed visual acuity, and corneal measures remained unchanged, indicating that keratoconus had not progressed [105].
The ocular symptoms of diabetes mellitus include blurred vision, and Scheimpflug imaging has been used to examine changes in ocular refraction and geometry in patients with diabetes [106]. During episodes of hyperglycemia, small hyperopic and myopic shifts of equivalent refractive error were observed; however, there were no significant changes in the shape of the cornea or lens in any patient and no correlations between changes in blood glucose levels and any measured ocular parameters. These results suggest that subjective symptoms of blurred vision during hyperglycemia are not caused by changes in the refractive properties of the diabetic eye.
3.5.5 Commercially Available Devices
Available units:
Pentacam®, Pentacam® HR, Oculus Inc., Lynnwood, WA
Galilei G2, Ziemer Group, Port, Switzerland
3.5.6 Considerations for Ocular Toxicology Studies
Excellent pupillary dilation is critical. Some research studies looking at the peripheral anterior structures have used iridectomized animals [99]. Applications for toxicology include the ability to document changes in the geometry of the crystalline lens and anterior chamber. High-resolution images may be suitable for imaging intracorneal pathologies lens opacities. Scheimpflug imaging may also be useful in monitoring the position of intraocular hardware such as intraocular lenses and pharmaceutical implants.
3.5.7 Limitations and Caveats
Studies with normal volunteers have demonstrated that Scheimpflug imaging results of corneal curvature and anterior chamber measurements [107] and corneal thickness [108] are highly repeatable and the application of geometrical and optical distortion correction algorithms can improve the accuracy of the measurements [89]. When applied to a range of patients, central corneal thickness measures from Scheimpflug, ultrasound and noncontact specular microscopy methods were well-correlated; however, Scheimpflug measures indicate small but significantly greater thicknesses than noncontact specular microscopy or ultrasound [69]. In that study, intraocular pressure was significantly correlated with central corneal thickness measured with noncontact specular microscopy and ultrasound but not the Scheimpflug system.
For measuring central corneal thickness, the results obtained with the Scheimpflug system are similar to those obtained with optical low-coherence reflectometer and ultrasound pachymeters [109] and show better agreement than scanning-slit topography following photorefractive keratectomy [110]; however, central corneal thickness measurements obtained using ultrasound pachymetry were significantly higher than a Scheimpflug camera system and anterior segment optical coherence tomography following laser keratomileusis [111].
The software available with commercial units allows for quantitative assessment of lens opacification in animals and may prove useful for noninvasive quantification of the progression of a cataractous process induced by a test material or implanted device. While testing this in the laboratory, we found it to be more applicable to non-rodent species that have larger anterior segments.
3.6 Ultrasound Biomicroscopy
3.6.1 Basic Principles
Ultrasonography is the workhorse of medical diagnostics in many fields, including ophthalmology. It has the advantage of producing images of internal organs in a noninvasive and nontoxic manner. High-frequency sound waves are generated by a transducer. The reflected waves or echoes are then detected by the same transducer. Timing of the reflected waves generally correlates with distance (an exception is when internal reflections or “ringing” occurs, as may be caused by a metal foreign body). A computer is used to produce a graph of reflection time vs. intensity (known as an “A scan”). By rapidly sweeping the probe along a plane, the computer can produce a 2-dimensional cross-sectional image showing distances along an X and Y axis. An additional Z axis illustrates the intensity of the reflected waves, the so-called B scan.
Traditionally, the sound frequency in ocular applications has been limited to 10 mHz, which permits detection of structures in the posterior segment of the eye, such as the vitreous, retinal, optic nerve, and orbit. It is particularly useful when media opacities prevent an adequate clinical exam. Beyond simple anatomic identification, the reflected ultrasonic waves give information about tissue density that is often critical in discriminating between tumor types.
More recently, higher ultrasonic frequencies of 12.5–50 mHz [112] and improved computing processing power have been employed to produce image resolutions that rival those of the light microscope. Such imaging is referred to as ultrasound biomicroscopy.
3.6.2 Performance Parameters
Ultrasound biomicroscopy systems are used for imaging the anatomy and pathology of the entire anterior segment including the cornea, iridocorneal angle, anterior chamber, iris, ciliary body, and lens. Consequently, ultrasound biomicroscopy can be used for the diagnosis of glaucoma and diagnostic imaging of ocular cysts and neoplasms [113] and to measure anterior segment parameters including central corneal thickness and anterior chamber depth peripheral iridocorneal angles [114]. It can also be used for evaluating traumatic injury and foreign bodies of the eye and ocular conditions such as siderosis bulbi caused by retained intraocular iron-containing foreign bodies [115].
In addition to diagnosing primary angle-closure glaucoma, ultrasound biomicroscopy can also determine the presence of plateau iris which is a non-pupil blocking cause of glaucoma [116]. In one case report, ultrasound biomicroscopy was used to diagnose pupillary block glaucoma secondary to device remnants remaining in the posterior chamber following phakic intraocular lens implantation [117].
Ultrasound biomicroscopy imaging has several presurgical applications. Prior to phakic intraocular lens implantation, ultrasound biomicroscopy can be used to measure intraocular structures [118] and corneal curvature [119] to improve the accuracy of intraocular lens sizing. Ultrasound biomicroscopy can provide detailed in vivo, imaging of primary iris melanoma which may aid in total surgical removal [120] and improved visualization and management of retinoblastoma [121] and determine vertical rectus muscle position prior to surgery [122].
In patients with acute anterior uveitis, ultrasound biomicroscopy can be used to observe severe inflammatory changes including large number of cells in the anterior and posterior chambers, marked edema and exudates in and around the iris and ciliary body [123]. In patients with unilateral exfoliation syndrome, zonular status in fellow eyes can be assessed prior to cataract extraction may serve as an aid in surgical planning [124].
Ultrasound biomicroscopy has also been used to evaluate the value of cryotherapy for preventing postoperative fibrovascular ingrowth of the anterior retina and sclerotomy sites and recurrent vitreous hemorrhage in patients undergoing pars plana vitrectomy for the treatment of proliferative diabetic retinopathy [125].
3.6.3 Use in Animal Toxicology and Other Ocular Research
Ultrasound biomicroscopy imaging has been used to determine the effect of mydriasis on the anterior segment in healthy dogs following the topical application of 0.5% tropicamide [126]. The result was an increase in the geometric iridocorneal angle and a decrease in the opening of the ciliary cleft, without any effect on the width of the mid-ciliary cleft, on the length of the ciliary cleft, or on the anterior chamber depth. It was concluded that topical tropicamide-induced mydriasis results in changes in the anterior segment which may influence the drainage of aqueous humor.
Ultrasound biomicroscopy imaging was also used to compare two rodent models of glaucoma. One eye of each animal in one strain of rats was treated with episcleral vein cauterization and the other strain with hypertonic saline episcleral vein sclerosis [127]. Eyes treated with episcleral vein cauterization developed higher intraocular pressure than hypertonic saline episcleral vein sclerosis-treated eyes. For all parameters, episcleral vein sclerosis-treated eyes cauterization did not differ significantly from control eyes, while experimental eyes in the hypertonic saline episcleral vein sclerosis group had larger anterior chamber depths and smaller ciliary body areas than control eyes which was found to correlate well with intraocular pressure.
In humans, changes in the angle opening distance following cataract surgery may be clinically useful for evaluating and treating eyes with angle-closure glaucoma or occluded angles. In an animal study, ultrasound biomicroscopy was used to compare the iridocorneal angle and angle opening distance in dogs with and without cataracts [128]. Dogs with cataracts were evaluated for postoperative ocular hypertension with the iridocorneal angle, angle opening distance, and postoperative anterior chamber debris. Dogs with larger presurgical iridocorneal angle and angle opening distance measurements were found to be at greater risk for postoperative ocular hypertension.
Ultrasound biomicroscopy has been employed in rhesus monkeys for studying accommodation, the process by which the eye focuses on near objects. The ciliary muscle is a sphincter muscle inside the eye that suspends the lens via threadlike structures called zonula. During accommodation, the ciliary muscle contracts and moves forward and inward to relax tension via the zonula to the lens. The lens then thickens allowing the eye to focus on nearby objects. With age, the ability to accommodate is lost (presbyopia). Ultrasound biomicroscopy permits detailed and dynamic imaging of the accommodative apparatus in the living eye (Fig. 3.12) [129, 130] as well as other intraocular structures for various scientific studies, such as the study of presbyopia [99, 129, 131]. With new imaging techniques (i.e., high-resolution ultrasound), these events can now be imaged in real time (http://www.iovs.org/cgi/content/full/51/3/1554/DC1) [129]. Measurements of the various accommodative structures can be obtained to characterize age-related changes in the eye (Fig. 3.13). In addition, various surgical procedures to disrupt the accommodative apparatus are being employed to further elucidate the mechanisms involved. Ultrasound biomicroscopy plays a key role in this effort (http://www.iovs.org/cgi/content/full/49/12/5495/DC1) [131].
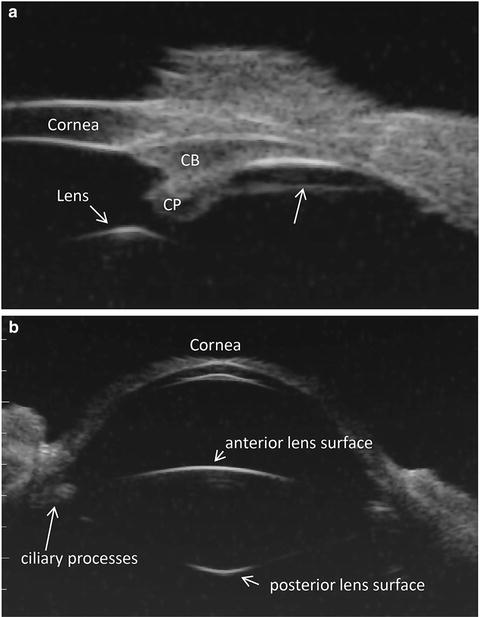
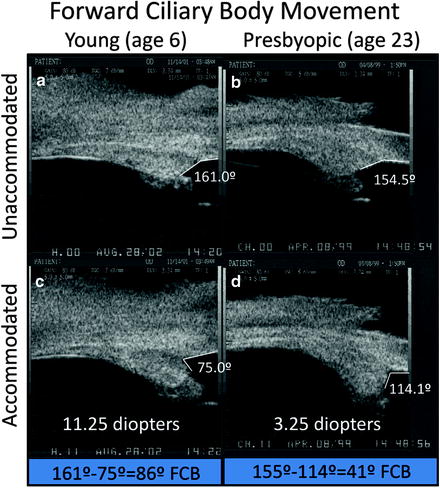
Fig. 3.12
Panel A. Ultrasound biomicroscopic overview image in a live rhesus monkey shows a prominent straight line (arrow) extending from the pars plicata region of the ciliary body to the ora serrata region separated from the pars plana epithelium by a cleft. CP ciliary processes, CB ciliary body (Lütjen-Drecoll et al. [129]; used with permission). Panel B. Ultrasound biomicroscopic overview image shows the anterior segment in a live young rhesus monkey
Fig. 3.13
Ultrasound biomicroscopy images of two normal monkey eyes, aged 6 years (A, C) and 23 years (B, D), in the unaccommodated and accommodated states. The change in angle between the anterior aspect of the ciliary body and the inner aspect of the cornea during supramaximal central stimulation was used as a surrogate indicator of forward ciliary body movement (Panels B and D adapted from Croft et al. [99]; used with permission) (Panels A and C adapted from Croft et al. [130]; used with permission)
3.6.4 Human Clinical Applications
Ultrasound biomicroscopy has been used in clinical trials which compared the effectiveness of different surgical procedures, such as the use of ab interno and ab externo scleral fixation of posterior chamber intraocular lenses [132].
Changes in anterior segment structures during accommodative stimuli following monofocal intraocular lens implantation were measured using ultrasound biomicroscopy [133]. Measured parameters included anterior chamber depth, iris/zonule distance, anterior chamber angle, scleral/ciliary process angle, and iris/ciliary process angle. All parameters except the horizontal iris/ciliary process distance and vertical anterior chamber angle and horizontal anterior chamber angle showed significant change during accommodation. An anterior shift of the intraocular lens/capsular bag ciliary processes/sulcus/zonular iris complex was observed. A simultaneous centripetal shift of ciliary bodies and processes was also observed as indicated by a sulcus and capsular bag diameter reduction.
Pigmentary glaucoma is a secondary type of open-angle glaucoma caused by pigment accumulation in the in the trabecular meshwork. Pigment dispersion syndrome is similar but with no evidence of glaucoma. Ultrasound biomicroscopy measured and compared different iridocorneal parameters in eyes affected by pigment dispersion syndrome or pigmentary glaucoma with matched controls [134]. The following parameters were assessed in relaxed and stimulated accommodative state: iris–lens contact, iridocorneal angle, and iris concavity. All ultrasound biomicroscopic parameters showed significant intergroup differences. Iridocorneal angle was the best-performing parameter followed by iris concavity, both in near vision. Receiver operating characteristic (ROC) analysis showed iridocorneal angle and iris–lens contact in near vision to be the most discriminatory parameters. These findings established that iris movement is important in inducing the clinical features of pigment dispersion syndrome and pigmentary glaucoma.
3.6.5 Commercially Available Devices
Available units:
Reflex Ultrasound Bio-Microscope. Reichert Technologies, Depew, NY
Eye Cubed, Ellex Medical Pty. Ltd., Adelaide, Australia
3.6.6 Considerations for Ocular Toxicology Studies
As with any sophisticated measurement instrument, proper operation and consistent data collection require a skilled and experienced operator. Low-frequency devices are available and used routinely in the clinic for relatively straightforward, subjective diagnosis of posterior segment problems such as retinal detachment and ocular tumors; however, the demands of research and ocular toxicologic studies require an understanding of the challenges involved.
Software that is provided by the manufacturer for clinical applications may not be suitable for research. Often greater flexibility is needed to permit off-loading of raw data for recording and image analysis.
3.6.7 Limitations and Caveats
Ultrasonic frequency needs to be chosen to meet the needs of a given study. Higher frequencies result in higher anatomic resolution but also require more time to set up since they must be used with a water bath. Depth of penetration of the sound has an inverse relation to its frequency and thus its resolution. Consequently, detailed ultrasound biomicroscopic images of the retina are not possible in the eyes of large animals or humans.
Preparing an animal for ultrasound biomicroscopy can also be a challenge. A water bath is essential, but the standard eyecup used for humans is inadequate for animals since in most species, the eye is too small and/or the available exposed sclera is limited. The animal needs to be anesthetized and the head position stabilized by an appropriate and often custom-made head holder. The eye is pointed upward and draped with a clear adhesive (Steri-Drape™; 3M Corporation, St. Paul, MN). To create a watertight seal around an animal eye, the fur may need to be trimmed and an additional adhesive such as collodion or benzoin is applied to the skin. A ring stand is a useful means of supporting the Steri-Drape to create a small pool of saline or other appropriate acoustic coupling solution.
A distinct advantage of ultrasound biomicroscopy is the power of the technique not just to see structures but to visualize and quantify their movements in real time for a better understanding of normal physiology, pathophysiology of disease, and device performance.
3.7 Laser Flare-Cell Meter
3.7.1 Basic Principles
The laser flare-cell meter is a noninvasive method for the in vivo measurement of aqueous flare (and/or cells) using the principle of laser light scattering detection. The instrument uses a diode laser beam that is projected inside the anterior chamber of the eye. Light scattering occurs as aqueous protein components of inflammation (commonly referred to as “flare”) pass through the focal point of the laser. The intensity of the scattered light is directly proportional to the amount of protein particles present which is detected by a photomultiplier tube, generating an electrical signal. The digitized signals are processed by a computer which eliminates outside noise interference and displays the results expressed as photons per millisecond for user analysis (Fig. 3.14). For review and opinion, see Ladas et al. [135], and Herbort et al. [136].
Fig. 3.14
Kowa FM-600 is based on the measurement principle of laser light scattering detection. The instrument uses a diode laser beam to scan a measuring window that is projected inside the anterior chamber of the eye. As an aqueous protein (component of inflammation) passes through the focal point of the laser, light scattering occurs. The intensity of the scattered light (directly proportional to the amount of protein particles, i.e., flare) is detected by a photomultiplier tube (PMT), which generates an electrical signal. These signals are immediately digitized to eliminate outside noise interference and are processed by a computer that displays for user analysis. The unit of measurement employed by the FM-600 is photon counts per millisecond (Kowa FM-600 technical manual; used with permission)
3.7.2 Performance Parameters
3.7.3 Use in Animal Toxicology and Other Ocular Research
The laser flare-cell meter has been shown to objectively quantify inflammation of the anterior chamber of the rabbit eye [137]. Following endotoxin-induced ocular inflammation, a linear relationship between the flare measurements and previously published measures of inflammation; however, false-positive results may occur in cases of severe uveitis. It has also been used to determine the efficacy and time to onset of effect of anti-inflammatory drugs [139–142], topical mydriatics and vasoconstrictors [143], and medicinal herbs [144] on prostaglandin-induced aqueous flare elevation in rabbits. It has also been used to assess the effects of topical carprofen on pilocarpine-induced irritation in dogs [145].
Using a rabbit model, the laser flare-cell meter has been used to evaluate the potential toxicity of intravitreal injections of bevacizumab [146], compare the effects of topical isopropyl unoprostone and latanoprost on prostaglandin-induced aqueous flare [147], and assess the ocular effect of microwaves [148].
3.7.4 Human Clinical Applications
Clinically, the laser flare-cell meter has been used to compare the long-term biocompatibility of intraocular lenses made from different materials in patients with uveitis of various origins [149, 150] and specifically patients with diabetes [151, 152]. Another major application of the laser flare-cell meter includes assessing the safety and efficacy of anti-inflammatory drug therapies before [153] and following cataract extraction [154–157]. It has also been used to assess the effects of postoperative atropine on central and peripheral anterior chamber depth and anterior chamber inflammation following primary trabeculectomy [158].
3.7.5 Commercially Available Device
Available unit:
Kowa FM-600 (Kowa Co. Ltd, Tokyo, Japan)
3.7.6 Considerations for Ocular Toxicology Studies
Unlike clinical observation, the laser flare meter produces quantitative data that, if collected correctly, is highly repeatable. Furthermore, the sensitivity of the instrument is superior to that of the human observer such that it can detect subclinical alterations in the anterior chamber protein concentration [159], an important consideration for drug toxicity studies.
3.7.7 Limitations and Caveats
Early models of laser flare meters incorporated the ability to count cells as well as flare; however, subsequent studies indicated that automated cell counting was unreliable except under highly controlled conditions [137]. This problem may result in part from the machine counting cellular debris as cells, an error that is less likely to occur with a human observer. High cellular concentrations are also prone to miscounting since the individual reflected peaks may be too close for the machine to recognize as distinct, resulting in undercounting. With low cellular density, the problem becomes one of obtaining an adequate sample size, whereas a human observer can quickly scan a large portion of the anterior chamber.
In humans, a number of factors may affect the laser flare meter readings, such as aging; medications such as acetazolamide, beta blockers, and pilocarpine; corneal opacity; pupil size; cataract; a shallow anterior chamber; and the presence of an intraocular lens. With the possible exception of pupil size, these would likely not apply to preclinical toxicologic studies. Nevertheless, the laser flare meter results should always be compared to clinical slit-lamp observation [135, 160].
In humans with uveitis, the laser flare meter seems to produce more repeatable results for anterior uveitis than it does for intermediate or posterior uveitis. Therefore, it has been suggested that at least 15 photons in the anterior chamber is the necessary threshold to produce reliable results in intermediate and posterior uveitis [160].
As with any sophisticated measurement device, operator skill and experience are relevant. Inter-operator variability could be an issue for toxicologic studies. Thus, appropriate training procedures and limiting the number of operators could improve consistency.
3.8 Fluorophotometry
3.8.1 Basic Principles
By measuring light emitted by the fluorescent tracer dye fluorescein, fluorophotometry can assess the integrity of various ocular barriers including blood–aqueous and blood–retinal barriers. It is also used for measuring aqueous flow and corneal endothelial permeability. The fluorophotometer projects a vertical slit of blue light into the eye, while a detector which measures fluoresced light is focused on the same point (Fig. 3.15). Only the fluorescence measured at the intersection of the two light paths is recorded. Fluorophotometry was originally designed to measure the leakage of fluorescein dye from the retina into the vitreous, but it has evolved to meet the needs of various areas of eye research. By accurately measuring fluorescence at discrete points in the eye, researchers can study several aspects ocular physiology (Fig. 3.16).
Fig. 3.15
The instrument works by projecting a beam of blue light in the form of a vertical slit into the eye. At the same time, a detector filtered to allow only fluoresced light is focused on the same point in the eye (http://www.ocumetrics.com)
Fig. 3.16
Principles of measurement of aqueous flow by ocular fluorophotometry. a Optical axis of eye is scanned for background fluorescence with a scanning ocular fluorophotometer. b Topical application of drops of fluorophore (2 % fluorescein) is applied to cornea. c After a suitable delay (approximately 15 h), to allow fluorescein to diffuse from the corneal depot to the aqueous humor, the eye is scanned once again. d Repeated scans at 30-min to 1-h intervals over a 3–6-h period facilitate monitoring of decline in fluorescence of aqueous humor with time. This can be related mathematically to aqueous flow rate (a calculation often performed by computer) after subtraction of background fluorescence and derivation of anterior chamber volume from keratometry and pachymetry determinations. The graphs to the right of the diagrams indicate typical fluorescence patterns obtained along the optical axis at each stage in the procedure. C cornea, AC anterior chamber, L lens, V vitreous (Gabelt et al. [283]; used with permission)
3.8.2 Performance Parameters
Fluorophotometry can detect increased permeability of the blood–retinal barrier, an early indication of ocular damage in patients with diabetes. Some structures in the eye such as the crystalline lens naturally fluoresce and as people age, glucose reacts with lens proteins to produce new fluorescent compounds. Since patients with diabetes have higher levels of blood glucose, these fluorescent compounds accumulate more quickly and measuring increased lens fluorescence can be used to screen people for diabetes. Similarly, the natural fluorescence of the cornea increases significantly in patients with diabetes and may represent another method for monitoring eye disease in these patients.
Clinically, a fluorophotometer was used to measure corneal fluorescein penetration for diagnosing dry eye disease. Following the topical application of fluorescein, patients with dry eye disease demonstrate increased corneal tissue fluorescence compared with normal subjects [161]. Other uses include measuring the permeability of the blood–retinal and blood–aqueous barriers (Fig. 3.17), vitreous diffusion, lens autofluorescence, aqueous and tear turnover, and cornea endothelial and epithelial permeability.
Fig. 3.17
The barrier between the blood system and the anterior segment of the eye is not as tight, so some fluorescein can penetrate it even under normal conditions. However, since the Fluorotron can make a precise measurement of the amount of fluorescein that gets in, it can easily differentiate a normal amount from an abnormally high amount. Inflammation can markedly increase the permeability of the blood–aqueous barrier. Inflammation can be caused by bacterial infection, surgery, and other diseases such as diabetes. A number of drug companies have used Fluorotron to run clinical trials on their anti-inflammatory drugs. These drugs decrease inflammation after surgery and thus also decrease permeability of the blood–aqueous barrier (http://www.ocumetrics.com)
3.8.3 Use in Animal Toxicology and Other Ocular Research
The properties of fluorophotometry make it a valuable research tool for studying a number of illnesses and conditions in animals including diabetes, uveitis, glaucoma, dry eye, and corneal surgery. Fluorophotometry has been used to evaluate the potential pharmacokinetic parameters of drug delivery following various periocular injections [162, 163] and to measure bioavailability of conventional eyedrops [164, 165]. Inflammation caused by bacterial infection or surgery can also increase the permeability of the blood–aqueous barrier, and pharmaceutical companies may use a fluorophotometer to study potential anti-inflammatory drugs.
Measuring the rate of disappearance of fluorescein instilled in the eye is also a useful measure of tear turnover and is of interest to contact lens companies. For example, tear flow estimates under soft lenses are very low compared to rigid lenses. This type of information is useful for studying contact lenses designed for overnight wear. By increasing tear flow under soft lenses, contact lens designers may be able to reduce complications of contact lens wear [166, 167].
Measuring aqueous humor formation via fluorophotometry is an important aspect of determining mechanism of action of compounds aimed at lowering intraocular pressure (IOP). Determining what portion of IOP lowering is due to increased outflow vs. decreased aqueous humor formation is a critical piece of information in glaucoma therapeutics. Most patients will need several medications of varying and complementary classes to control their IOP in what is a lifelong disease [168–170].
3.8.4 Human Clinical Applications
In humans, the accumulation of fluorescent substances (autofluorescence) is associated with the progression of eye aging and cataract formation. A prospective cohort study using fluorophotometry demonstrated a loss of lens transparency occurs in patients following trabeculectomy for the treatment of in primary open-angle glaucoma [171]. Compared to baseline assessments, this change was significant after 12 months and was not observed in other patients with open-angle glaucoma that did not undergo the procedure.
Fluorophotometry has also been used assess the efficacy and safety of a stent for the treatment of open-angle glaucoma by measuring changes in aqueous humor dynamics [172]. Using fluorophotometry, aqueous flow and trabecular outflow facility were measured before and after implanting a stent connecting the anterior chamber with Schlemm’s canal. Patients treated with stent implants and cataract surgery displayed significantly increased trabecular outflow facility, reduced intraocular pressure, and reduced need for medications compared with patients treated with cataract surgery alone.
Hyaluronic acid has been proposed as a topical agent for the treatment of dry eye disease. To describe the behavior of hyaluronic acid on the ocular surface, hyaluronic acid conjugated with fluorescein was topically applied to the eyes of health human volunteers and measured fluorophotometrically [173]. Compared to saline, hyaluronic acid had a longer retention time, possibly by adhering to the surface of the eye.
3.8.5 Commercially Available Devices
Available units:
F-7000 Fluorescence Spectrophotometer
F-2500 Fluorescence
Fluorotron™ Master Ocular Fluorophotometers
3.8.6 Considerations for Ocular Toxicology Studies
Fluorophotometry can provide objective, quantitative measures of the physiological and pathological state of the retinal vasculature, the pigmented epithelium, the choroid, and the ciliary processes. It is a valuable tool for detecting physiological changes such as inflammation and monitoring treatment progress in preclinical and clinical drug development. A laboratory animal-specific system is commercially available (Fig. 3.18). It has adjustments for the optics of a variety of species, increasing its utility in preclinical work. The performance specifications are the same as for human systems.
Fig. 3.18
Fluorophotometry is the established method for quantitating the permeability of the blood–retinal barriers and the blood–aqueous barrier. By measuring the concentration profile of the tracer fluorescein within the ocular cavity, the dynamics of intraocular diffusion and elimination can be accurately monitored. The resulting determinations provide indications of the physiological and pathological state of the retinal vasculature, the pigment epithelium, the choroid, and the ciliary processes. The objective and quantitative capabilities of fluorophotometry permit the detection of physiological changes very early in the course of certain diseases and the monitoring of progress in treatment (http://www.ocumetrics.com)
3.8.7 Limitations and Caveats
Species selection and anesthesia are both important variables in study design. Data are not necessarily comparable across species. Anesthetics can have differential effects depending on the species and level of anesthesia needed to obtain high-quality scans. While the procedure is relatively simple, it takes operator skill to be able to accurately obtain the scans and evaluate the results.
3.9 Scanning Laser Ophthalmoscope (SLO)
3.9.1 Basic Principles
Scanning laser ophthalmoscopy is a method of examining the eye using the technique of confocal laser-scanning microscopy. A confocal scanning imager synchronously moves a spot of illumination and a detector over the image. SLO employs mirrors to horizontally and vertically scan a specific region of the retina and create images viewable on a computer monitor. It can provide crisp and complete retinal images without pupil dilation [174] although good dilation may be preferable, especially when obtaining stereoscopic images.
3.9.2 Performance Parameters
SLO provides imaging of the retina or cornea of the human eye with a high degree of spatial sensitivity that makes it a very useful aid in the diagnosis management of glaucoma, diabetic retinopathy, macular degeneration, and other retinal disorders. SLO systems have been adapted for use in studying both the anterior and posterior segments of the eye (see Sect. 3.3). For example, Heidelberg Engineering has an anterior segment module (ASM) for their Spectralis™ system that can perform optical coherence tomography on the cornea, iris, and lens.
3.9.3 Use in Animal Toxicology and Other Ocular Research
SLO has been useful in for studying toxicity and for research in animals with large as well as small eyes (Fig. 3.19). Using laboratory small-eyed rodents such as hamsters and gerbils, confocal SLO together with other visualization techniques has been used for the study of human diseases, such as age-related macular degeneration and diabetic macular edema [175]. Confocal SLO has been developed into a technique for assessing corneal surfactant irritation in rabbits and mice [176], the response of acute anterior chamber inflammation to various treatments [177] and to measure changes in the topography of the optic nerve head following subconjunctival injection of unoprostone (isopropyl unoprostone) in rabbits [178].
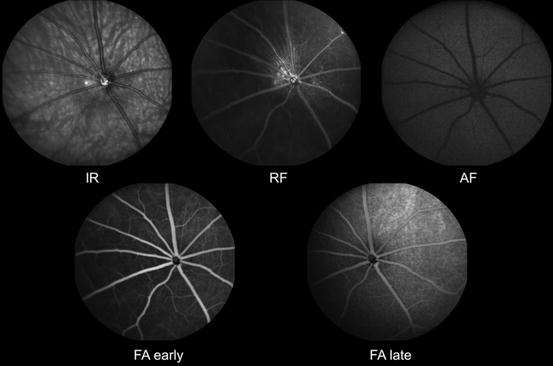
Fig. 3.19
Scanning laser ophthalmoscopic images of rat retinas. IR infrared, RF red free, AF autofluorescence. FA early, early phase fluorescein angiogram. FA late, late phase fluorescein angiogram (Courtesy Heidelberg Engineering. Images provided to Heidelberg by Sinisa D. Grozdanic, College of Veterinary Medicine, Iowa State University)
Using murine Müller glial cells as potential targets for gene therapy, SLO has been used to detect transgene expression in the mouse retina following intravitreal injection of adeno-associated virus [179]. Confocal SLO has also been used to study cone survival in transgenic mouse models of retinal degeneration [180]. Using a specific strain of engineered knockout mice, SLO together with other histological and biochemical assessments has been used to study the pathogenesis of choroideremia, a progressive X-linked disease characterized by the degeneration of photoreceptors and retinal pigment epithelium [181].
The combination of fluorescence adaptive optics with SLO results in a novel imaging method that enables in vivo imaging of nerve fiber layer vasculature in living macaque monkeys [182]. This technique enables researchers to examine the possible role of the nerve fiber layer vasculature in retinal vascular disorders and other eye diseases, such as glaucoma.
3.9.4 Human Clinical Applications
Confocal SLO provides objective and quantitative measurements that are highly reproducible and show very good agreement with clinical estimates of optic nerve head structure and visual function in clinical practice and also in glaucoma trials [183]. For example, confocal SLO studies have shown that baseline Glaucoma Probability Score can be used to predict the development of primary open-angle glaucoma [184]. By comparing normal and glaucomatous eyes using confocal SLO, the retinal nerve fiber layer showed a stronger structure–function association and a higher diagnostic sensitivity for glaucoma detection than the neuroretinal rim [185].
A possible risk factor for glaucoma is central corneal thickness, possibly by affecting the elastic properties of the eye. A study using confocal SLO revealed no significant relationship between these two parameters in healthy eyes [186]. The correlation between the retinal blood flow measured with a retinal functional imager and central macular thickness and volume has also been assessed by a combined spectral scanning laser ophthalmoscopy/optical coherence tomography system [187].
Adaptive optics SLO has also been used to measure disease progression and their response to treatment, such as the use of sustained-release ciliary neurotrophic factor for inherited retinal degeneration [188] and intravitreal bevacizumab for the treatment of radiation retinopathy [189]. The combined use of SLO with spectral-domain optical coherence tomography revealed microstructural changes in eyes with progressive geographic atrophy due to age-related macular degeneration [190]. SLO is an effective means for monitoring the efficacy of treatment of neurodegenerative diseases of the retina in clinical trials [191] and has also been used to assess drug-induced ocular toxicity. For example, SLO has been used to quantify retinal nerve fiber layer and macular thickness loss as markers of retinal damage in patients with vigabatrin-associated vision loss [192]. Examples of SLO fundus imaging for human clinical use are shown in Figs. 3.20, 3.21, and 3.22.
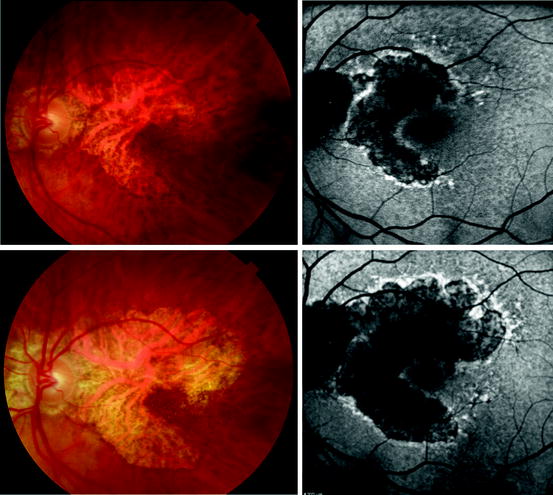
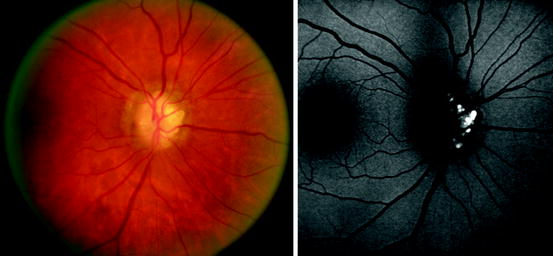
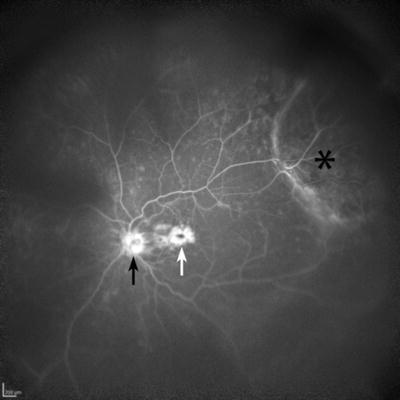
Fig. 3.20
Left column, standard white light digital fundus photographs of the retina of an 87-year-old woman with geographic age-related macular degeneration. Right column, fundus autofluorescence images taken with a scanning laser ophthalmoscope camera (Heidelberg HRA II). Top row, the color and autofluorescence images both taken on the same day. Bottom row, the color and autofluorescence images taken on the same day 3 years and 3 months after the top row of images. Note the increase in size of the area of atrophy. The autofluorescence images show a decrease in fluorescence compared to normal levels (compare with retina peripheral to the lesion) in the center of the atrophic region; however, the edge of the atrophic region is hyperautofluorescent. Hyperautofluorescence of the retinal pigment epithelium may be an indicator of active degeneration
Fig. 3.21
Left, color standard digital photograph of an abnormal appearing optic nerve. Right, autofluorescence imaged obtained with a scanning laser ophthalmoscope (Heidelberg HRA II). Marked autofluorescence is evident in a nodular pattern consistent with a diagnosis of optic nerve head drusen
Fig. 3.22
Wide-angle fluorescein angiographic image taken with the Heidelberg HRA II scanning laser ophthalmoscope utilizing the Staurenghi contact lens. A mass (choroidal melanoma) is seen in the superotemporal periphery (asterisk). The optic nerve (black arrow) shows late fluorescein staining, and there is prominent late leakage consistent with cystoid macular edema (white arrow) (Courtesy of Diagnostic Services, Flaum Eye Institute, University of Rochester)
3.9.5 Commercially Available Devices
Available units:
F-10 Scanning Laser Ophthalmoscope, NIDEK, Inc., Fremont, CA
< div class='tao-gold-member'>Only gold members can continue reading. Log In or Register to continue
Stay updated, free articles. Join our Telegram channel

Full access? Get Clinical Tree


