Fig. 4.1
(a) ERG response of the right (top) and left eye (bottom) to a dim flash from the eye of a monkey that has been previously dark-adapted. Cursors have been placed on the waveforms. The voltage difference between cursor 1 and cursor 2 is the amplitude of the b-wave. The latency to the peak of the b-wave is the implicit time. (b) ERG recorded as in 1A to a bright flash (ISCEV recommends 3 cd -s m−2). This stimulus strength elicits a measureable a-wave, indicated by cursor 1. This negative voltage waveform is generated by the rod and cone photoreceptors. At moderate flash intensities, there is also a substantial contribution from the on- and off-bipolar cells to the onset and offset of the brief flash stimulus. (c) Oscillatory potentials are derived from the ERG recorded in B by applying a band-pass filter, typically 70–120 Hz to extract the wavelets shown in C. Oscillatory potentials are quantified by summing the amplitude of the individual waves. (d) Light-adapted ERG (photopic) to the same flash stimulus in B. The state of light adaptation completely alters the form of the ERG, underlining the importance of complete dark adaptation and sufficient light adaptation times. (e) Photopic ERG to 30-Hz flicker. Note the quasi-sinusoidal appearance of the ERG at this high repetition rate
The most prominent feature of a typical ERG waveform is the b-wave. Practical application of ERG assessment typically involves assessment of b-wave amplitude and implicit time or latency, which is the time from stimulus until peak b-wave amplitude. For rod, cone, and combined responses, amplitude is measured from the trough of the a-wave to the peak of the b-wave (or from the base of the b-wave when it masks the a-wave). Data are often normalized by calculating the percentage relative to prestudy values for individual animal data. It is crucial to collect both prestudy data and data from a control group for comparison. For oscillatory potential and flicker responses, the quality of the waveform is as important as the amplitudes and latencies. Again, a comparison to prestudy values for individual is useful.
The pupils should be maximally dilated, and animals must be sedated to allow proper positioning, usually in a Ganzfeld (Fig. 4.2) device to ensure uniform distribution of light to the retina. Lid specula are used to keep the lids open, and other positioning measures such as stay sutures may be required to ensure the eyes are in central gaze.
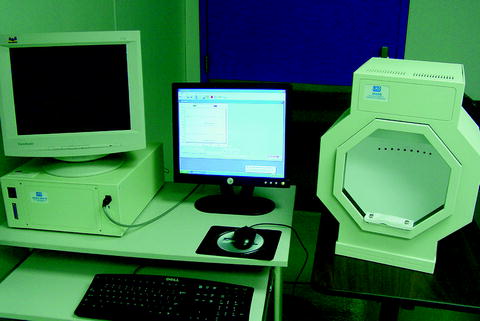
Fig. 4.2
Electroretinograph with full-field photostimulator noted on the right. The animal’s head is placed in the photostimulator to achieve uniform flash illumination and maximal efficiency for retinal stimulation
Even with the above standardizations, electroretinographic responses in normal animals are subject to a high degree of variability at different time points and can vary by as much as 25% from one time to the next. Therefore, it is important to compare mean responses of all animals in each group with respect both to the control group as well and the initial baseline means of the responses. An analysis of variance with the prestudy values as the covariate is often performed to assess group differences.
Signal averaging is also a tool that has been used in each individual animal’s recordings to eliminate background “noise” (electrical activity from muscle contractions, cardiac activity, and electromagnetic interference from other equipment.), but it is important to space the stimuli adequately to ensure the repeated responses are not so frequent as to bleach rhodopsin and adversely affect components such as the rod responses.
4.2.3 Use in Ocular Toxicology Research
The ERG is increasingly used in preclinical safety studies. It provides a noninvasive assessment of retinal function unavailable through other means. Given the complex nature of the visual cycle, high metabolic rate of the photoreceptors, the visual transduction cascade, and neural processing in the retina required for a normal retinal function, ERG testing may be useful for screening compounds with a wide variety of targets. Target organs may include the eye and any compound that binds melanin in the retinal pigment epithelium, including psychotropic compounds and antimetabolics for neoplastic targets.
4.2.4 Human Clinical Applications
Clinically, the ERG is used primarily to diagnose inherited retinal diseases. For example, a child with nystagmus will have a differential diagnosis list that includes congenital motor nystagmus, neurologic causes, Leber’s amaurosis, achromatopsia, and albinism, among others. The scotopic and photopic ERG will both be normal in motor nystagmus and albinism, both will be flat in Leber’s congenital amaurosis, and only the photopic ERG will be extinguished in achromatopsia. The ERG is also helpful in assessing the functional effect of foreign intraocular bodies (ocular siderosis) and toxicities.
4.2.5 Commercially Available Devices
Diagnosys LLC, Lowell, MA
LKC Technologies, Inc., Gaithersburg, MD
Electro-Diagnostic Imaging, Inc., Redwood City, CA
4.2.6 Considerations for Ocular Toxicology Studies
A complete ERG test using the minimum five conditions will require at least 1 h of dark adaptation, 10 min for electro application, 10 min for scotopic testing, 10 min for light adaptation, and 10 min for photopic testing. While the dark-adapted portion may be overlapped between animals, it is clear that the full ERG test is time-consuming. For species with no macula and a rod-dominated retina, it may be cost-effective to perform only the scotopic tests. It is also time-consuming to individually score the ERG waveforms. An automated processing system may reduce human error and speed the process considerably.
4.2.7 Limitations and Caveats
The FERG has the advantage that it is relatively easy to record (compared with multifocal or pattern ERG), with a relatively large voltage signal (microvolts vs. nanovolts). However, because it is a mass response, the proportional contribution of the retinal that would be removed by a small lesion is often undetectable with the FERG. The FERG is best suited to detecting effects that affect all the cells of a given layer (photoreceptors, bipolar cells) in a similar way. It is important to note that loss of the ganglion cell layer or optic nerve axons is not detectable via the FERG.
4.3 Multifocal Electroretinography (mfERG)
4.3.1 Basic Principles
The full-field ERG gives a mass response recording of retinal activity and is unable to detect small localized regions of impaired activity. For example, a lesion localized to the central fovea of the primate retina would have a normal full-field ERG, but the visual consequences of a lesion in this location would be profound. Fortunately, additional tools have been developed that allow localizing regions of electrical activity within the retina, providing a spatially distributed map of retinal functionality.
Using electrodes placed on the cornea and the skin near the eye, electroretinography measures the electrical response of various types of retinal cells to standardized flashes of light [8, 9]. The resulting signal is displayed as an electroretinogram (ERG) which shows the time course of the signal’s voltage amplitude. The ERG is composed of the sum of electrical potentials contributed by different types of retinal cells including photoreceptors, bipolar cells, and ganglion cells. By altering the stimulus conditions such as flash or pattern stimulus, background lighting, and different colors of stimulus and background, stronger responses from areas of the retina can be elicited. For example, if an ERG is recorded to a dim flash delivered to the dark-adapted eye, the response is from the rod system, while the response from a light-adapted eye is from the cone system. The response evoked from an alternating checkerboard stimulus is due to ganglion cell activity (see Section 4.4 of this chapter on the pattern reversal ERG (PERG)).
In 1992, Sutter and Tran [10] described a means by which regional ERG responses can be determined and mapped in a manner analogous to the way that human visual fields are mapped. This is accomplished by having the subject (either a conscious human or anesthetized animal) gaze at monitor that displays a rapidly changing pattern of white and black hexagons in a pseudorandom pattern (the so-called m-sequence). As is the case with the full-field ERG, only a single active electrode is used (plus a nearby reference electrode and distant indifferent electrode). Computer software then utilizes the complex m-sequence pattern of stimulation to isolate responses from multiple regions of the retina. The regional responses are, individually, similar in appearance to the full-field ERG waveform, that is, a negative going initial wave (N1) followed by a positive wave (P1) plus latter waves (N2 and P2). It also has a high-frequency component that is reminiscent of the full-field ERG oscillatory potentials; however, the cellular origins of the mfERG waveforms may be somewhat different than for the better studied full-field ERG. For example, work by Hood and colleagues [11] suggests that the early waveforms (N1 and P1) may be attributable to responses of the bipolar cells as compared to the full-field ERG in which the first negative going wave (the a-wave) is mostly the result of photoreceptor activity. Even so, drug toxicity or disease-related injury to the photoreceptors would have an effect on the mfERG since they are what drive the bipolar and ganglion cells.
Typically 103 or 241 separate stimulus elements are employed that together cover up to ±44° of the central visual field. Since the standard full-field ERG testing is the sum of all retinal activity, the multifocal ERG (mfERG) was developed to assess local regions of the retina. The mfERG thus provides spatial information about diseases of the outer retina that could be missed using full-field ERG. For example, a recent study used the mfERG to monitor injury and recovery of retinal function following creation of localized retinal detachments by subretinal injection of balanced salt solution [12].
4.3.2 Performance Parameters
The mfERG can also be used to detect the localized loss of central activity in various maculopathies such as age-related macular degeneration [13], vitelliform maculopathies, macular holes and juvenile retinoschisis, central serous retinopathy [14], vascular disorders, diabetic retinopathy [15], and inflammatory retinal diseases. The mfERG can also be used to detect injury to cone receptors, the inner and outer plexiform layer, on- and off-bipolar cells, and ganglion cells [8]; however, most of the energy of the mfERG waveform is produced by the outer retina with the ganglion cells contributing only a small component limited to the late wave features. Because of this, the mfERG has not proven practical for monitoring ganglion cell loss, such as seen in human glaucoma [16, 17]. The visual evoked potential VEP and PERG are more useful measures of ganglion cell function. Attempts have been made to improve the sensitivity of the mfERG to inner retinal injury by using slow-flash mfERG [18] or by measuring the so-called optic nerve head component [19, 20]. Even with these refinements, the mfERG is limited in its practical ability to measure ganglion cell function.
4.3.3 Use in Ocular Toxicology Research
A considerable amount of research has been performed using rhesus and cynomolgus monkeys using mfERGs. Initial studies examined retinal changes in experimentally induced glaucoma [21, 22] in the hopes that the mfERG would prove to be an aid in the clinical diagnosis and management of glaucoma. Unfortunately, as noted above, the mfERG waveform has only a weak input from the retinal ganglion cells, the primary cell that is permanently damaged in glaucoma; however, there is mounting evidence that the photoreceptors themselves are injured, but not necessarily lost in glaucoma [23]. To evaluate the relationship between elevated intraocular pressure and the mfERG response, glaucoma was experimentally induced in rhesus and cynomolgus monkeys by using a laser to destroy the trabecular meshwork of one eye [23]. Some animals had undergone prior unilateral optic nerve transection to determine the contribution of ganglion cells to mfERG changes. The results of this study demonstrated species-specific, reversible changes in cone-driven retinal function during periods of elevated intraocular pressure, which can occur in the absence of retinal ganglion cells. The primary effect was an increase in amplitude of the N1and P1 waveforms (Fig. 4.3). Such increases in the full-field ERG (variously described as supranormal or hyperabnormal) are one of the possible effects of various retinal diseases in humans [24].
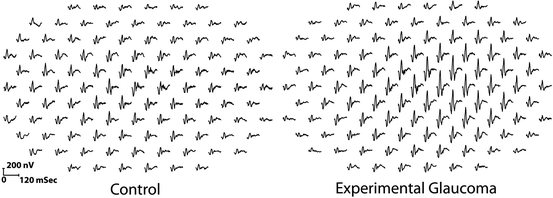
Fig. 4.3
Comparison of unstretched 103 element mfERG traces extending ±44° from fixation in a rhesus monkey. The trace array on the left is from the control left eye, and the one on the right is from the right eye with experimental glaucoma. The traces from the glaucomatous eye are exaggerated or “supranormal” indicating outer retinal (photoreceptor and/or bipolar cell) injury
4.3.4 Human Clinical Applications
Bevacizumab is a drug used to inhibit angiogenesis. Optical coherence tomography (OCT) and mfERG were used to assess macular function before and after intravitreal administration of bevacizumab in patients with choroidal neovascularization due to age-related macular degeneration [25]. Prior to treatment, OCT showed increased thickening of the fovea and decreased electrical response density in the fovea and parafovea. Three months after treatment, OCT showed resolution of the subretinal fluid, while the mfERG responses in the fovea and parafovea remained unchanged or slightly improved. The intraocular pressure remained normal, and no inflammation was observed. These results suggest that intravitreal bevacizumab may aid in the treatment of choroidal neovascularization although additional studies are required to establish clinical benefits.
The primary clinical application of the mfERG is to assist in the diagnosis of vision loss by helping to localize the functional defect. An example is monitoring for drug toxicity, such as hydroxychloroquine (Plaquenil®) that initially affects only a small area surrounding the fovea. mfERG testing is often combined with full-field ERG and VEP testing to further characterize the pathology.
4.3.5 Commercially Available Devices
Available Units:
VERIS™ Multifocal System with Integrated Ganzfeld Stimulator and FMS II Stimulator/Refractor/Eye & Fundus Monitoring System
Electro-Diagnostic Imaging, Inc., Redwood City, CA
LKC™ Multifocal ERG/VEP with Long Binary m-Sequences
LKC Technologies, Inc., Gaithersburg, MD
4.3.6 Considerations for Ocular Toxicology Studies
There are several aspects of mfERG testing in anesthetized animals that must be taken into account. Unlike conscious humans, the animals will not fixate on the target in the center of the stimulus monitor. Thus, the animals will need to be positioned such that the eye is facing in the proper direction. In our laboratory, we secure the head with an oral bit head holder and then align the eye with a reversing ophthalmoscope [26]. A standard direct ophthalmoscope has been modified with a mirror (corner cube). The fovea is identified and placed in the center of the crosshair of the ophthalmoscope, which is then clamped into place. A mirror (corner cube) is slid down to direct the light and crosshair toward the monitor. If necessary, the monitor is then moved to line up with the back-projected crosshair (Fig. 4.4). Newer mfERG systems have camera monitoring systems that permit the operator to project the stimulus directly onto the retina, thus greatly simplifying the alignment process. Even with careful alignment, it is not always possible to exactly center the stimulus. Therefore, it is best with the animals to use an unstretched stimulus (Fig. 4.4) in which slight misalignment is not so critical.
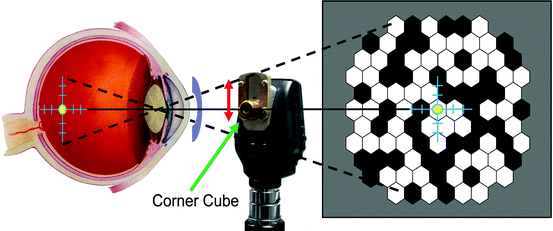
Fig. 4.4
Schematic of alignment method for an anesthetized animal. A direct ophthalmoscope (center) is used to project a crosshair onto the desired location, which in primates would typically be the fovea. The ophthalmoscope is then clamped, and a custom-made mirror (corner cube) is raised to back project the crosshairs onto a target screen, which is then moved to line up with the back-projected crosshair. An example of an unstretched stimulus pattern (right) used for animal research is shown. An ERG-jet® electrode is also illustrated
4.3.7 Limitations and Caveats
1.
mfERG testing in anesthetized animals requires a skilled operator who can troubleshoot technical problems as they arise.
2.
There is moderate test-retest variability in the mfERG waveforms that requires averaging over several test periods to extract subtle toxicity effects [23]; however, moderate to marked effects are readily apparent with single recordings.
3.
The mfERG generates a tremendous amount of data—essentially normal full-field ERG responses multiplied by 103 or 241. We have found it critical to develop computer software (MATLAB®, by MathWorks™, Natick, MA) to assist in data analysis [23].
4.4 Pattern Reversal Electroretinography (PERG)
4.4.1 Basic Principles
The pattern reversal electroretinogram (PERG) is a very small amplitude retinal biopotential generated by a pattern stimulus that is thought to reflect the activation of proximal retinal layers, such as ganglion cells. The PERG thus complements the full-field standard ERG, which is largely driven by distal retinal photoreceptors and bipolar cells. The key feature of the PERG stimulus is that the temporally modulated pattern has no net change in luminance over time. Examples of PERG stimuli include checkerboard patterns in which the black and white squares exchange position every 0.5 s and sinusoidal gratings in which the peaks and troughs alternate phase according to a temporal sine wave. The PERG is most commonly evoked by alternating black and white elements of a checkerboard or by a stripe pattern. The PERG is measured through standard electrodes in contact with the cornea, bulbar conjunctiva, or via periocular skin electrodes. PERG stimuli may be chromatic (red/green, blue/yellow) or achromatic (black/white) with the caveat that the pattern stimulus must be in optimal refraction through the recording electrode. Isolated amplification systems and low-noise recording environments are necessary because the PERG is indeed a very small signal (∼2 μV) compared with the ERG elicited by full-field stimulation (>200 μV). Averaging of a large number of stimulus reversals is commonly needed to achieve an adequate signal-to-noise ratio (SNR). The many stimulus factors affecting the PERG include the spatial frequency of the pattern, temporal rate of phase reversal, luminance, contrast, and chromaticity of the pattern, waveform processing method, type and arrangement of electrodes, background illumination, retina stimulus position, refractive error, and patient age [29].
The PERG was first described by Riggs and colleagues [30–34] who documented its spatial and temporal properties. Maffei then showed that sectioning the optic nerve in cat, monkey, and rat resulted in a gradual decline in the PERG while the standard full-field ERG was unchanged [35–37]. Subsequent research showed that the PERG is markedly affected in human glaucoma [29, 38–45] and inner retinal dysfunction [46–51] as would be expected of a measure of ganglion cell function.
4.4.2 Performance Parameters
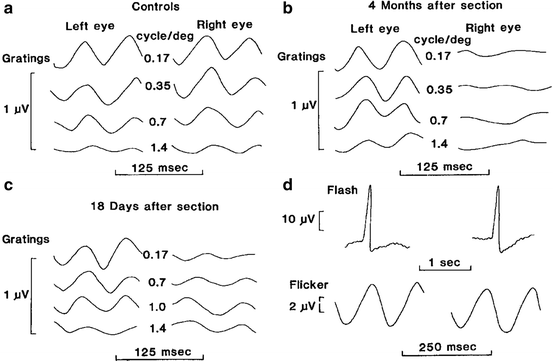
Stimuli used for the PERG are similar to those used for the pattern reversal visual evoked potential (PRVEP). The temporal aspects of stimulation determine to a large extent the shape of the PERG waveform. Figure 4.5 shows the PERG elicited by a slow (<6/s) pattern alternation from an example used for illustration in the ISCEV standard. This is the “transient” PERG. The steady-state PERG is elicited by faster temporal rates (>8/s). Figure 4.6 shows the results of the classic Maffei and Fiorentini [52] experiment in which they recorded steady-state PERGs following optic nerve transaction. Note the loss of the steady-state PERG at 4 months while transient flash ERG and steady-state full-field flash ERGs remained unchanged.
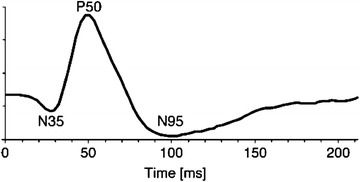
The outcome variables from the transient PERG are the amplitude and peak latencies of the waves labeled in Fig. 4.5, namely, the negative voltage waves with average peak latencies of 35 and 95 ms straddling the prominent P50 positive voltage wave with an average latency of 50 ms. The N95 component is the waveform feature that has been linked with retinal ganglion cell function, whereas the P50 is associated with a distal retinal component. As shown in the idealized transient PERG wave in Fig. 4.5, the amplitude of the PERG is on the order of just a few μvolts, requiring the experimenter to ensure very low levels of noise during the recording. The steady-state PERG (Fig. 4.6) assumes a quasi-sinusoidal appearance, and typically the amplitude and phase of the second harmonic of the signal are used for analysis.
When properly used, the PERG provides a highly sensitive biomarker for retinal ganglion cell function [29, 53–55]. Clinical studies have examined the utility of the PERG in the diagnosis and assessment of glaucoma and ocular hypertension [45, 53, 56, 57]. These studies have shown that the PERG is markedly reduced in human glaucoma and that some PERG stimuli (high temporal frequency, multiple check sizes) may be optimal for identifying patients with incipient glaucomatous damage [44, 53]. Despite a large body of research showing the value of the technique, routine clinical application of the PERG in glaucoma management has remained elusive.
4.4.3 Use in Animal Toxicology and Other Ocular Research
As expected, the PERG is markedly altered in animal models of glaucoma and ocular hypertension. PERG is also reduced in murine models of spontaneous glaucoma [51, 58, 59]. Porciatti has shown that the PERG declines markedly with age in the DBA/2J mouse, which develops a pigmentary glaucoma postnatally (Fig. 4.7). PERGs are also sensitive to experimental glaucoma in monkeys [60–63].
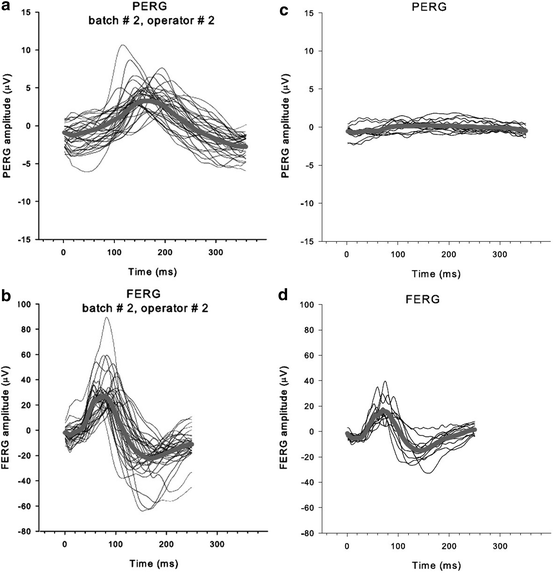
Fig. 4.7
(a) PERG and (b) full-field ERG (FERG) recorded from 22 3–4-month-old DBA/2J mice. Thin lines: individual waves; thick lines: averages. (c) PERG recorded from six older DBA/2J mice (12–14 months old). (d) FERG from same animals as in (c). Note the selective reduction of the PERG and preservation of the FERG, reflecting selective loss of ganglions cells (From Porciatti et al. [65])
Although the PERG is a technically demanding potential to record, in animals it can provide similar information to the cortical VEP and may be much easier to obtain than the VEP. For example, PERGs have been used to measure psychophysical responses in pigeons [64, 65]; however, of note is the finding that in pigeons, transaction of the optic nerve does not abolish the PERG [48, 66, 67], which suggests that in the pigeon, retinal ganglion cells are not the generators of the PERG and that other cell types in the inner retina (e.g., amacrine) may play an important role. Nevertheless, with the caveat that species differences may be critically important, the PERG may provide an estimate of spatial acuity in smaller animals more readily than the VEP in some experimental situations. Work from Frishman and colleagues has delineated the specific pathways in the C57BL/6 mouse that give rise to the PERG [68].
4.4.4 Use in Human Clinical Research
In addition to studies of glaucoma, there is a substantial body of research using the PERG to document pathologic changes in the retina in patients with idiopathic Parkinson’s disease [71–75]. These studies suggest that in addition to higher cortical functions, there is evidence of retinal function in these patients. Visual symptoms including a decline in the PERG may be an important indicator of cognitive decline in patients with Parkinson’s disease [76]. In children with optic nerve hypoplasia (ONH), the N95 component of the PERG is diminished, but ONH may also involve more distal layers of the retina [77]. The N95 component of PERG, together with full-field ERGs and the flash VEP, has been found to be predictive of visual outcomes in children with ONH [78]. The PERG has also been used to monitor macular function following laser treatment in patients with macular degeneration [79, 80]. These studies have demonstrated that, in addition to the N95 ganglion cell component, the PERG is also useful marker of macular function.
The PERG has not been used extensively as a biomarker for toxic exposures. However, in one case report, transient PERG and transient pattern VEP were used to assess ocular status in Amazon gold miners who chronically inhaled mercury vapor [81].
4.4.5 Commercially Available Devices
Available Units:
Diagnosys LLC, Lowell, MA
LKC Technologies, Inc., Gaithersburg, MD
Electro-Diagnostic Imaging, Inc., Redwood City, CA
Cadwell Laboratories, Inc., Kennewick, WA
Electrical Geodesics, Inc., Eugene, OR
4.4.6 Considerations for Ocular Toxicology Studies
The PERG is a technically demanding recording. Refraction and optical clarity are essential to obtain meaningful results. For many PERG recordings, a fiber electrode [82, 83] is useful to avoid optical distortions created from standard contact lens ERG electrodes. For animals, it is necessary to be able to refract the animals using streak retinoscopy or other means. In addition, the stimulus must be aligned optically with the fovea or other retinal landmark using a reversing ophthalmoscope or other suitable optical technique. Because of the low signal amplitude, there may be ambiguity with placement of the cursors used to measure amplitude and peak latency or implicit time, particularly in animals with experimentally reduced PERGs. New methods have been introduced for improving the reliability of cursor placement in high-noise recordings [84].
4.4.7 Limitations and Caveats
The PERG is a small amplitude signal that is typically generated from a pattern displayed on a computer monitor. Older CRT monitors may create a large electromagnetic field that could be synchronized with the stimulus. Thus, it is critical to measure the PERG in the apparatus used with zero contrasts (no visible pattern) in order to ensure recordings are free from artifact. Of great importance is the fact that LED displays have backlit features that may introduce a luminance artifact that could masquerade as a PERG. As indicated from work with pigeons reviewed above, there may be large species differences in the relative contribution to the PERG from retinal ganglion cells versus other cells of the inner retina, making it necessary to validate the PERG in each species.
4.5 Visual Evoked Potential (VEP)
4.5.1 Basic Principles
Visual evoked potentials (VEPs) are changes in electric fields generated in the cerebral cortex when activated by visual stimulation. See Nunez and Srinivasa [85] and Regan [86] for reviews. VEPs are typically recorded noninvasively via scalp electrodes positioned over the occipital lobe, although for research purposes, VEPs may be recorded from electrodes placed directly on the surface of the cortex. In order to achieve sufficient amplitude to be recorded from scalp electrodes, the visual stimulus must elicit a time-locked activation of cortical neurons. An action potential traveling down an axon releases a neurotransmitter into the synapse which binds with a receptor on the membrane of the target cell which alters current flowing into the cell. This current flow generates an electromagnetic field. If there is sufficient depolarization of the target cell, an action potential is generated that transmits the signal via the target cell’s axon to the next cell; however, only volume-conducted magnetic and electric fields generated by the current flow into the cell bodies are detectable extracellularly from surface electrodes. Action potentials per se are not recordable via scalp electrodes. Detection of magnetic field dipoles requires highly specialized low-temperature detectors which have been rarely used outside of research. Electric fields are measured as the potential difference between the active electrode and a reference electrode over a nonactive site. Only the synchronous activation of very large numbers of neurons (compound activity) can result in a summed potential (an electric field created by changes in intracellular ionic concentrations) that is large enough to be recorded from the scalp. Note also that the orientation of the dipole within the cortical tissue must be radial with respect to the recording electrodes in order to be detected; orthogonally oriented dipoles are not detected. It is for this reason that VEPs are often recorded using several electrode montages. Unlike single-unit recordings, the VEP represents a mode of response that must be common throughout the cortex. Another advantage of the VEP as an imaging technique includes the fact that it is a relatively fast measure, typically resolved within 250 ms, compared with fMRI, which takes orders of magnitude longer to resolve.
4.5.1.1 Averaging
The classic technique for obtaining a VEP uses “averaging” to extract the small field potential from the much larger background EEG. In the classic averaging method, a visual stimulus is presented, such as a strobe flash, checkerboard pattern reversal, or grating onset at a fairly slow rate (2 s−1), and the occipital EEG (electrode placement at O1 and O2 plus a midline Oz channel is common) is digitized in time-ordered bins for a given period, typically 300 ms following the stimulus [87]. The voltage in each time bin is summed across the number of stimulations, typically 64 or greater. The signal-to-noise ratio (SNR) increases with the square root of the number of stimulations; thus, there is a large gain in SNR with the initial stimulations, and benefits diminish at very high numbers of stimulations. Poststimulus epochs where the occipital EEG voltage is consistently above zero will sum to a positive VEP “wave,” whereas EEG that is negatively correlated with stimulus onset will sum to a negative voltage wave, and activity that is unrelated to the stimulus will, in the long run, sum to zero. Figure 4.8a shows an idealized VEP evoked by flash stimulation, and Fig. 4.9a shows a VEP evoked by pattern reversal (PRVEP) stimulation, both following the ISCEV standard example [87]. It is also possible to record VEPs from a “steady-state” stimulus (ssVEPs)—a flash or pattern reversal that is presented at a temporal rate that is sufficiently rapid to drive the cortex in a quasi-sinusoidal output. The amplitude and phase of the harmonics of the ssVEPs can be extracted with a Fourier transform or other frequency-domain techniques, avoiding traditional averaging. In certain applications, ssVEPs are more efficient than time-averaged VEPs but at the expense of losing detail about the waveform. VEPs are also classified by the spatial aspects of the stimulus. Common spatial patterns include strobe flash, checkerboards, dartboards, sinusoidal gratings, and vernier offsets.
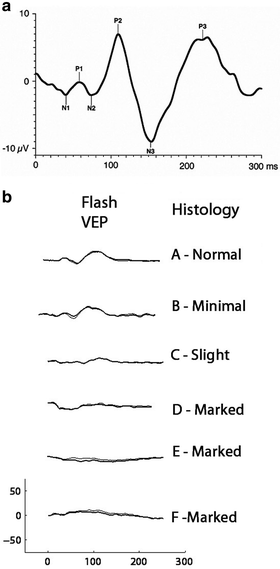
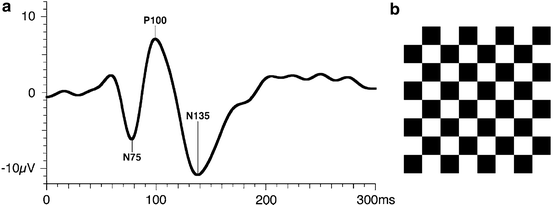
Fig. 4.8
(a) Ideal flash visual evoked potentials (FVEPs) recorded from human showing the major waveforms using ISCEV VEP standard. From Odom et al. [87]. (b) FVEPs recorded from six monkeys under anesthesia. On the right is the histologist’s rating of the degree of optic nerve atrophy. FVEPs are depressed or abolished in animals with evidence of atrophy judged “marked” (From Dubielzig et al. [103])
Fig. 4.9
(a) Ideal pattern reversal VEP recorded from human showing the major waveforms using ISCEV VEP standard. From Odom et al. [101]. (b) Checkerboard pattern used in PRVEP. The transient PRVEP shown is the average cortical response elicited by the exchange of black and white checks at a rate of 2 s−1
4.5.1.2 Frequency Labeling
The Fourier transform of a steady-state VEP contains energy peaks at the fundamental and the harmonics of the temporal frequency of the stimulus. In frequency labeling techniques, the stimulus is modulated in time while another stimulus attribute, for example, spatial frequency, is swept through a range [86]. A narrow-band digital filter that passes only the energy at the stimulus frequency is applied to the occipital EEG, and the resulting amplitude and phase are plotted as a function of the swept stimulus attribute. This situation is analogous to an amplitude-modulated (AM) radio: the flickering of the stimulus is the “carrier frequency,” and the amplitude of the demodulated signal from the EEG is similar to the loudness of the radio signal. Frequency labeling methods are the basis of the “sweep VEP” acuity in which the spatial frequency (inverse of bar width) of a grating is increased while the light and dark bars are exchanging position at a constant rate. In humans, the intersection of the slope of the sweep VEP with 0 μV (or background EEG noise) correlates well with subjective acuity as determined by an eye chart. Frequency labeling has been applied to VEP measurement of vernier acuity [88], motion [89, 90], and binocular interactions [91, 92].
4.5.1.3 Cross-Correlation Methods
Recently, the multifocal or m-sequence methodology has been applied to VEPs. Sutter [93–95] introduced a pseudorandom stimulation method based on the m-sequence that has found widespread clinical application in the form of multifocal ERGs and multifocal VEPs [16, 96–99]. In a simple cross-correlation, the stimulus sequence is correlated with a channel of recorded EEG. The offset between the stimulus sequence and recorded physiology is then shifted one sample at a time, and the correlation is repeated. If this procedure is repeated for the desired number of poststimulus msec, the shape of the evoked potential is recovered. The m-sequence is a pseudorandom series of stimulus sequences for multiple stimulus inputs with the unique property that the correlation between all possible pairs of sequences is exactly zero. This means that the cross-correlation between one pseudorandom m-sequence and the recorded physiology is independent from all other inputs. The mfVEP can be thought of as creating a “spatial dissection” of the VEP waveform across the visual field. In humans, mfVEPs often show polarity inversion around the calcarine sulcus corresponding to the upper and lower visual fields. The standard PRVEP averages across these individual waves, probably contributing to interindividual variability.
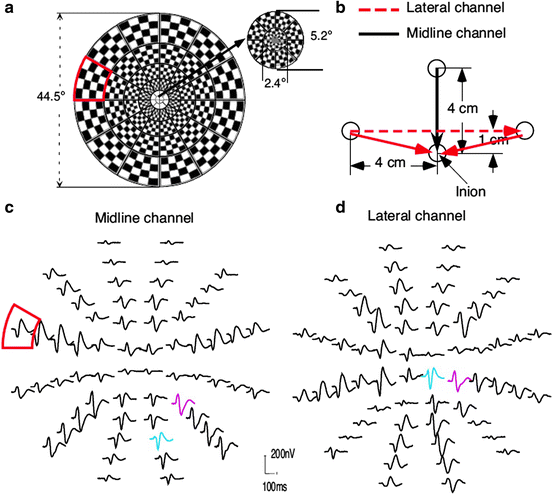
A multifocal VEP typically uses 60 small checkerboard patterns that alternate black and white according to an m-sequence (Fig. 4.10). The m-sequence allows extraction of VEPs from each of 60 locations across the visual field; however, the technique is not limited to the standard checkerboard pattern. In addition, the multifocal VEP requires recording from at least two orthogonal occipital EEG channels [11, 100].
 < div class='tao-gold-member'>


Only gold members can continue reading. Log In or Register to continue
Stay updated, free articles. Join our Telegram channel
Full access? Get Clinical Tree
